Investing in AI: Navigating the Hype
- Kai Wu

- Jul 18, 2023
- 33 min read
Updated: May 16, 2025
July 2023
Executive Summary
Artificial intelligence is poised to transform the economy. However, AI stock valuations have already soared in anticipation. We create a GPT-based “AI financial analyst” to help uncover less-obvious stocks expected to profit from the rise of AI. Drawing lessons from the dot-com bubble, we show how “intangible value” can help investors navigate the hype cycle. Next, we evaluate the AI exposure of popular ETFs. Finally, we identify employers that stand to benefit from the impact of Generative AI on their workforces.
Tech Bubbles 🫧
The Age of AI
“The development of AI is as fundamental as the creation of the microprocessor, the personal computer, the Internet, and the mobile phone. It will change the way people work, learn, travel, get health care, and communicate with each other. Entire industries will reorient around it. Businesses will distinguish themselves by how well they use it.”
🤖 Bill Gates, The Age of AI Has Begun
Artificial intelligence is all the rage today. While years in the making, ChatGPT’s meteoric success has sparked a torrent of excitement. The transformative potential of large language models (LLMs) like ChatGPT has led to a frenzy of investment from corporations, venture funds, and stock investors.
We believe that AI is the real deal. We have been using LLMs in our investing for several years and were early advocates of their potential. In Deep Learning in Investing (Jul 2020), we argued that the “killer application” of AI for investors is the ability of LLMs to unlock insights in vast unstructured text.
However, when it comes to investing in so-called “AI stocks,” we are more circumspect. Since ChatGPT burst on the scene, investors have rabidly bid up the prices of AI-related stocks.
Exhibit 1
AI Stocks Take Flight (2023 YTD Return)

Source: S&P, Sparkline. Total returns from 12/30/2022 to 6/30/2023.
As a result, the valuations of these stocks have skyrocketed. Nvidia, the dominant producer of chips used by AI models, is now trading at a lofty price-to-sales ratio (P/S) of 40.4.
Exhibit 2
Nvidia Price-to-Sales

Source: S&P, Sparkline. Trailing Sales is trailing 12-month sales. Forward Sales is the average analyst estimated sales for the upcoming year. From 12/31/1999 to 6/30/2023.
This surge has led many skeptics to proclaim an “AI bubble.” While we do not believe AI is in a full-fledged bubble quite yet, historical patterns suggest this as a probable outcome.
In Investing in Innovation (Apr 2022), we found that all past technological revolutions (e.g. steam, electricity, oil) were accompanied by bubbles. Despite the success of the underlying technologies, investors who bought overpriced assets in these speculative periods suffered poor returns. A look back at the Internet revolution offers a cautionary tale.
Hype.com
“Every bubble consists of a trend that can be observed in the real world and a misconception relating to that trend.”
📈 George Soros
In the late 1990s, investors were consumed by excitement over the enormous potential of the Internet. By 2000, there were dozens of Internet stocks trading at dizzying Nvidia-like multiples. Cisco, the largest member of the Nasdaq 100, boasted a P/S ratio of 30. Most astonishingly, Red Hat, the enterprise Linux purveyor, racked up a P/S ratio over 1000!
Exhibit 3
Dot-Com Darlings, Price-to-Sales (Jan 1, 2000)

Source: S&P, Sparkline. Holdings for a portfolio of U.S. Internet stocks formed on 1/1/2000 with P/S ratios over 25. For illustrative purposes and not an exhaustive list. As of 1/1/2000.
These astronomical multiples reflected investors’ unbridled bullishness toward the Internet. And, indeed, these firms flourished as the Internet gained widespread adoption. Over the next two decades, their sales compounded at a torrid 12% per year for a cumulative 11-fold increase!
Exhibit 4
Dot-Com Darlings, 2000-2019

Source: S&P, Sparkline. Return decomposition is for a portfolio of U.S. Internet stocks formed on 1/1/2000 with P/S ratios over 25. Total Return includes returns from not only Fundamental Growth and Multiple Expansion, but also Dividends and Buybacks. From 1/1/2000 to 1/1/2020.
However, despite the triumph of the Internet, these firms delivered very poor returns for investors. In 2000, Internet hype began to subside and their valuation multiples went into freefall. The ensuing reversion of their P/S ratios from a lofty 33.3 to a modest 5.2 resulted in a harrowing -85% loss.
These crippling losses from multiple compression more than offset strong fundamental growth. By 2002, investors had lost 80% of their money. While these companies did eventually grow into their peak bubble multiples, it wasn’t until May 2018, an agonizingly long 18 years later!
The moral of the story is that valuations matter. Investing in stocks exposed to rapidly growing technologies only works if this growth is not already priced in. Unfortunately, in periods of euphoria, the market has a tendency not only to price in potential growth but also to greatly over-extrapolate it.
The Dot-Com Bubble
Wayback Machine 📜
Let’s continue our exploration of the dot-com bubble. To do this, we need a way to determine what firms were thinking in real time. Fortunately, the historical record of corporate thought is chronicled in the annual 10-K reports public firms are required to file with the SEC. For example, here is an excerpt from Goldman Sachs’ FY1999 10-K filing.
Exhibit 5
Goldman’s Internet Strategy (FY1999)
Internet Strategy
We believe that Internet technology and electronic commerce will, over time, change the ways that securities and other financial products are traded and distributed, creating both opportunities and challenges for our businesses. In response, we have established a program of internal development and external investment.
Internally, we are extending our global electronic trading and information distribution capabilities to our clients via the Internet. These capabilities cover many of our fixed income, currency, commodity, equities and mutual fund products in markets around the world. We are also using the Internet to improve the ease and quality of communication with our institutional and high-net-worth clients. For example, investors have on-line access to our investment research, mutual fund data and valuation models. In addition, our high-net-worth clients are increasingly accessing their portfolio information over the Internet. We have also recently established GS-OnlineSM, which, in conjunction with Goldman, Sachs & Co., acts as an underwriter of securities offerings via the Internet and other electronic means. GS-OnlineSM will deal initially only with other underwriters and syndicate members and not with members of the public.
Recently, we established an internal working group to focus primarily on utilizing the Internet to enhance and support our wealth management business. Externally, we have invested in electronic commerce concerns such as Bridge Information Systems, Inc., TradeWeb LLC, Archipelago, L.L.C., The BRASS Utility, L.L.C., OptiMark Technologies, Inc. and Wit Capital Group, Inc. Through these investments, we gain an increased understanding of business developments and opportunities in this emerging sector.
Source: SEC, Sparkline.
In this 10-K, Goldman acknowledges the disruptive potential of the Internet and outlines its Internet strategy. It is using the Internet to better interface with wealth management, trading, and investment banking clients. In addition, it is investing in external Internet-based assets (e.g., TradeWeb).
In an ideal world, we would carefully read all the 10-Ks filed in the decade around the Internet boom. Unfortunately, these documents are notoriously voluminous. In 1999, the average 10-K crammed in over 30,000 words (more than George Orwell’s Animal Farm); and these filings have only grown more bloated since!
Exhibit 6
10-K Literary Epic

Source: WSJ, Tim Loughran and Bill McDonald.
Furthermore, regulatory filings are far from riveting page-turners. Even for the most diligent analyst, the task of manually poring over the thousands of such sprawling documents released each year sounds like a punishment ripped straight from the pages of an Orwellian dystopia!
AI Financial Analyst 🤖
Fortunately, LLMs are adept at quickly processing millions of dense text documents without complaint. In this section, we build a GPT-based “AI financial analyst” to handle the tedious chore of dissecting these hefty reports.
However, before we can do this, we need to first solve an important limitation of LLMs. The problem is that LLMs can only process a finite amount of text per query. For example, GPT-3.5 can only handle around 3,000 words at a time, about 10% the length of the average 1999-vintage 10-K.
Our workaround is to feed the model only the most relevant paragraphs from each 10-K. In order to assess the relevance of each passage, we utilize embedding-based search. Loyal readers will recognize embeddings as a mainstay in many of our previous papers (e.g., 2019, 2020, 2021, 2022, 2023).
Embeddings encode text into numerical vectors, which can then be compared based on geometric proximity using basic linear algebra. We compare the embedding for each excerpt to that for the phrase: “Will the company benefit from the rise of the Internet?” In Goldman’s 10-K, “Internet Strategy” is more relevant than “Competition” for answering this.
Exhibit 7
Embedding Search Example

Source: SEC, Sparkline.
Now that we have indexed each paragraph, we construct a prompt that includes the most relevant excerpts along with instructions to use these excerpts to answer the question, “Will the company benefit from the rise of the Internet?” For each 10-K, we include as many passages as we can fit into the model’s context window.
We provide this prompt to GPT-3.5 Turbo 0613, a 175 billion parameter transformer LLM, which was pretrained on a large corpus of data and fine-tuned by human engineers. Results for a selection of 10-Ks are presented below.
Exhibit 8
AI Response Examples 🤖
GeoCities (FY1998)
Yes. The company is positioned to benefit from the rise of the Internet. The excerpts mention that it is the world's largest and one of the fastest-growing communities of personal web sites on the Internet. It has experienced significant growth in memberships, page views, and unique visitors. Additionally, the company has formed strategic partnerships with leading Internet vendors, such as Amazon.com, CDnow, First USA, and Surplus Direct/Egghead, which provide opportunities for revenue sharing and ongoing revenue streams. Furthermore, it plans to expand globally and capitalize on the anticipated growth of Internet usage internationally. Overall, its large and growing web community, along with its multiple revenue streams from advertising, commerce, and premium membership service fees, position it to benefit from the rise of the Internet.
Estée Lauder (FY1999)
Yes. The company expects to benefit from the rise of the Internet as they have started selling their Clinique and Origins products directly to consumers over the Internet. This indicates that they are embracing e-commerce and leveraging the online channel to reach a wider customer base and increase sales. Additionally, they have developed a system to manage their promotional business and processes on both an individual brand and corporate basis. These initiatives demonstrate the company's proactive approach to utilizing technology and the Internet to enhance their marketing and sales strategies.
7-Eleven (FY1999)
No, I do not expect this company to benefit from the rise of the Internet. The 10-K statement does not mention any specific strategies or initiatives related to e-commerce or online sales. Additionally, the company states that it does not currently think that its traditional sales categories will be impacted by the availability of merchandise over the Internet. Therefore, it is unlikely that the company will benefit from the rise of the Internet.
Our AI analyst does a nice job synthesizing the information in the 10-Ks, providing intuitive and logical explanations to support its assertions. Importantly, it mostly ignores firms that mention the Internet but fail to provide details on how they specifically will benefit. While not always perfect, our AI analyst offers a quick, cost-effective, and scalable way to process tens of thousands of 10-K filings.
We now have an assessment of each company’s exposure to the rise of the Internet. Moreover, the annual filing cadence allows us to monitor how the Internet strategies of firms, industries, and the broad market evolve over time. As expected, the share of firms orienting toward the Internet increased alongside Internet adoption.
Exhibit 9
Increasing Internet Adoption

Source: SEC, OpenAI, S&P, World Bank, Sparkline. Sparkline. Universe consists of the top 1,000 U.S. stocks by market capitalization. From 1/1/1996 to 1/1/2002.
Next, we construct an equal-weighted index of stocks that our AI analyst believes will “benefit from the rise of the Internet” based on their most recent 10-K. Each month, it rebalances as Internet strategies evolve. The next exhibit shows the returns of the index relative to the market.
Exhibit 10
Internet Stock Returns

Source: SEC, OpenAI, S&P, Sparkline. Universe consists of the top 1,000 U.S. stocks by market capitalization. Strategy consists of all stocks considered to be positioned to benefit from the Internet based on their most recent 10-K. Returns shown relative to an equal-weighted portfolio of all stocks. Simulation does not include transaction or shorting costs or fees. See important backtest disclosure. From 1/1/1997 to 1/1/2004.
The good news is that we successfully capture the sentiment of the dot-com bubble. The bad news is that the returns are not good. After outperforming in the boom, Internet stocks suffered a full round-trip collapse in the bust. It turns out that naively buying all Internet stocks in the Internet revolution was not actually a good investment strategy!
Value Investing in Bubbles
“I didn't get rich by buying stocks at a high price-earnings multiple in the midst of crazy speculative booms, and I'm not going to change.”
💼 Charlie Munger
The investment industry is increasingly divided into warring “value” and “growth” factions. The dot-com bubble served as perhaps the greatest litmus test of this bifurcation. Many value investors chose to sit out the entire period, suffering years of deep underperformance in the boom. Meanwhile, numerous growth investors rushed eagerly into the inflating bubble, only to see their gains vanish in the ensuing bust.
We believe in a middle way. Innovation is the lifeblood of our economy and investors should actively seek exposure to this secular growth engine. At the same time, it’s crucial to heed the warnings of prudent value investors and avoid potential losses from speculating in overpriced stocks.
The problem is that traditional valuation metrics (e.g., price-to-book-value) have limited relevance in today’s information economy. Asset-light firms, like Google and Amazon, derive profits not from tangible but intangible assets, such as intellectual property, brand equity, human capital, and network effects. Unfortunately, these intangible assets are inadequately represented in accounting statements.
Exhibit 11
Intangible Moats

Source: Sparkline.
In Intangible Value (Aug 2021), we proposed a framework for quantifying these elusive intangible assets using insights in alternative data (e.g., patents, job posts).
Exhibit 12
Building Intangible Value

Source: Sparkline.
Since these data consist mainly of unstructured text, we first utilize AI/LLMs to convert them into structured factors, which we then scale by price (e.g., price-to-innovative-patents). Next, we combine dozens of these metrics into the four pillars and then into a composite Intangible Value score.
As intangibles gain in importance, Intangible Value metrics have become increasingly essential for assessing the fair value of stocks, especially those in new-economy sectors such as the Internet. Using Intangible Value, we filter out the 50% most expensive firms from our Internet index. Exhibit 13 shows some of the remaining “Cheap Internet Stocks.”
Exhibit 13
Cheap Internet Stocks (Jan 1, 2000)

Source: SEC, OpenAI, S&P, Sparkline. For illustrative purposes. Not an exhaustive list. As of 1/1/2000.
The strategy contains a broad mix of firms. About 40% of the portfolio consists of new-economy tech or telecom stocks, such as Apple, Synopsys, and Bell Atlantic. The remaining 60% is filled with stocks from the old economy, such as American Express, Nike, and Estée Lauder.
The next exhibit compares the value characteristics of cheap Internet stocks to those of their more expensive peers.
Exhibit 14
Internet Stock Valuations

Source: S&P, USPTO, LinkedIn, SEC, OpenAI, Sparkline. All calculations are weighted averages with weights equal to position size. All metrics except price are calculated over a trailing 12-month window. R&D is research and development. S&M is sales and marketing. *Patents and PhDs are scaled by billions (e.g., # patents per $1 billion market cap). As of 1/1/2000.
As expected, our portfolio is much more attractive on both conventional and Intangible Value metrics. For each dollar invested, shareholders receive more earnings, free cash flow, patents, PhD employees, and brand capital.
The next exhibit backtests the returns of Cheap Internet Stocks and Expensive Internet Stocks compared to those of the market. For reference, we also show the returns of All Internet Stocks versus the market. As before, all strategies are rebalanced monthly and positions are equal-weighted.
Exhibit 15
Tale of Two Internets ☯️
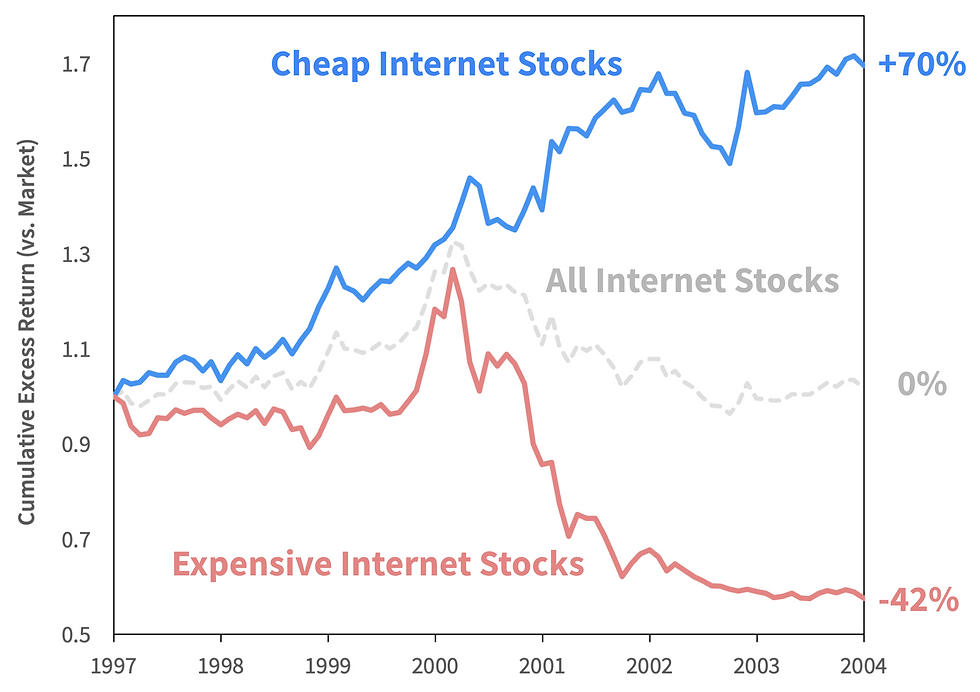
Source: SEC, OpenAI, S&P, Sparkline. Universe consists of the top 1,000 U.S. stocks by market capitalization. Internet Stocks are those considered to be positioned to benefit from the Internet based on their most recent 10-K. Cheap (Expensive) Internet Stocks are Internet stocks in the top (bottom) half of intangible value. Returns shown relative to an equal-weighted portfolio of all stocks. Simulation does not include transaction or shorting costs or fees. See important backtest disclosure. From 1/1/1997 to 1/1/2004.
Splitting our Internet stock index into cheap and expensive halves reveals a stark bifurcation. Cheap Internet Stocks beat the market consistently through the boom-bust cycle, adding a cumulative +70%. On the other hand, Expensive Internet Stocks lagged the market by a dismal -42%, fully offsetting the outperformance of Cheap Internet Stocks.
Finally, we compare the returns of Cheap Internet Stocks to Expensive Internet Stocks. We decompose total returns into three components based on the formula:
Total Return = Sales Growth + Multiple Expansion + Income
Exhibit 16
Cheap vs. Expensive Internet Stocks

Source: SEC, OpenAI, S&P, Sparkline. Universe consists of the top 1,000 U.S. stocks by market cap. Internet Stocks are those considered to be positioned to benefit from the Internet based on their most recent 10-K. Cheap (Expensive) Internet Stocks are Internet stocks in the top (bottom) half of intangible value. Sales Growth is relative change in sales per share. Multiple Expansion is change in relative P/S ratio. Income is cumulative relative dividends. Simulation does not include transaction or shorting costs or fees. See important backtest disclosure. From 1/1/1997 to 1/1/2004.
First, focusing on total returns, we find that Cheap Internet Stocks consistently outperformed expensive ones, except for when expensive stocks spiked at the height of the bubble. Fortunately, this brief dip was followed by two very strong years for Cheap Internet Stocks as the bubble unwound.
Next, we learn that Cheap Internet Stocks had slower sales growth than their more high-flying peers but that this was more than offset by stronger gains from multiple expansion. This “less growth but more multiple expansion” split is a defining feature of value investing. This gives us comfort that our strategy can indeed be characterized as “value.”
It is often said that value investing does not work for picking stocks in new-age sectors or during periods of speculative excess. However, using Intangible Value, we were able to successfully apply value principles to innovative Internet stocks, even amidst the crucible of the dot-com bubble!
Surfing Tech Waves 🌊
In Liquid Venture Capital (Sep 2022), we argued that liquidity is effectively an “option” granting investors the ability to change their minds and respond to new opportunities. Since option value is a function of implied volatility, liquidity should be especially valuable in the periods of high dispersion caused by technological disruption.
The next exhibit underscores the value of liquidity by contrasting the strategy from the previous section with a version where holdings were frozen on 1/1/1997. Forgoing the option to trade significantly degrades performance.
Exhibit 17
Option Value of Liquidity

Source: SEC, OpenAI, S&P, Sparkline. Dynamic strategy defined above. Static strategy is the same with weights frozen on 1/1/1997. Simulation does not include transaction or shorting costs or fees. See important backtest disclosure. From 1/1/1997 to 1/1/2004.
The static strategy underperforms for two reasons. First, it is unable to respond to changes in firms’ Internet positioning. It cannot sell when its holdings’ Internet strategies falter, nor can it buy when new Internet stocks enter the universe.
Second, it is unable to respond to changes in valuations. In a hype cycle, innovative stocks often experience narrative-led price spikes. Ideally, we want to take profits when valuations soar and buy back after they subsequently collapse. This approach gives us long exposure to secular growth while also “harvesting” the mean reversion of valuations.
Exhibit 18
Surfing the Hype Cycle 🏄

Source: Gartner, Sparkline. “Buy” and “Sell” show idealized buy and sell points.
In technological revolutions, locking oneself into the current opportunity set can be very costly. Instead, investors should attempt to “surf the hype cycle” by dynamically adjusting their portfolios as fundamentals and valuations evolve.
Investing in the Age of AI
Back to the Future 🚀
“Software is eating the world, but AI is going to eat software.”
🤖 Jensen Huang, CEO of Nvidia
Let’s now return to the technological revolution at hand. In the last section, we tasked our AI analyst with identifying firms that were positioned to benefit from the rise of the Internet. We can adapt this approach to the present day by posing a new question to our AI analyst: “Will this company benefit from the rise of AI?”
Before we do this, let’s make a quick upgrade to our AI. Since the 1990s, digitized data has grown exponentially. We now have access to a plethora of new alternative data sources. In previous papers, we showed how investors can derive insight from a wide variety of such unstructured data (e.g., patents, social media, Glassdoor reviews).
While human analysts may struggle to process millions of disparate texts, our AI analyst is perfectly suited to scale over the breadth of our data. We first index our entire document library using embeddings. Then, whenever we come up with a new question to ask our AI analyst, it can quickly pull up the most relevant passages to use in forming its response.
Exhibit 19
AI Analyst Workflow

Source: Sparkline.
The choice of which datasets to give our AI analyst is critical. In prior research, we have used three classes of data to uncover AI innovators:
📣 Corporate Communications (e.g., 10-Ks, earnings calls)
🕵️ Third-party Analysis (e.g., Crunchbase)
We have found that using a combination of all three types produces the best practical investment results. However, for this paper, we will only use corporate communications data to ensure comparability with our prior dot-com analysis.
Each month, we look over a trailing one-year window that includes the latest 10-K and four quarterly earnings calls. We add a citation feature, allowing us to trace back each claim to the relevant excerpt. Exhibit 20 shows a few responses.
Exhibit 20
AI Game Recognize Game
Yes. The excerpts mention that the company is excited about using LLMs to improve user experiences in various areas, including Search, YouTube, and Workspace (Excerpt: 2023 Q1 Earnings Call, 3). They also mention that Google Cloud is engaging with organizations across the board, from start-ups to large companies, to use AI for transformation (Excerpt: 2023 Q1 Earnings Call, 4). Additionally, the firm has released its PaLM API and MakerSuite tool to provide access to large language models and build generative AI applications quickly (Excerpt: 2023 Q1 Earnings Call, 2). The company's focus on incorporating generative AI advances into its products, such as Search, and its commitment to developing more capable and useful AI systems further indicate its potential to benefit from AI tools (Excerpt: 2023 Q1 Earnings Call, 1).
S&P Global
Yes. In the first excerpt from the 10-K, the company mentions that they have made investments in decision sciences, AI, and machine learning. They specifically mention their investment in Kensho, which is working on large language models for the financial markets (Excerpt: FY 2022 10-K, 1). Kensho has developed products like Kensho Link, Extract, NERD, and Scribe, which utilize AI and machine learning to ingest and analyze large amounts of data, saving time and improving efficiency. Additionally, Kensho is developing a financial language model called [Fin LM] trained on S&P Global data assets. (Excerpt: 2023 Q1 Earnings Call, 3) In the second excerpt, the company states that they have already embedded a lot of Kensho's products and tools within their businesses and have a strong team of Kensho experts. They mention that they have the largest training dataset for financial markets and do not need to export their data to someone else's models or generic large language models. They also hint at future announcements related to AI and machine learning. (Excerpt: 2023 Q2 Earnings Call, 2)
Moderna
Yes. The excerpts mention that the company is utilizing AI for predictive modeling, improving mRNA design algorithms, and gaining critical insights into research, supply chain, manufacturing, and other processes (Excerpt: FY 2022 10-K, 1). The company has also launched an AI Academy in partnership with Carnegie Mellon University to educate and empower employees to integrate AI and machine learning solutions into their systems and processes (Excerpt: FY 2022 10-K, 3).
Source: SEC, S&P, OpenAI, Sparkline. As of 6/30/2023.
These firms are leveraging AI in diverse ways. Google is integrating LLMs into consumer apps, selling AI cloud infrastructure, and offering LLM APIs to developers. S&P’s Kensho is using AI to help clients ingest and analyze data and is training a proprietary LLM on its unique data assets. Moderna is applying AI in use cases ranging from mRNA design to supply chain optimization and is partnering with Carnegie Mellon to bring AI education to its employees.
Overall, our AI analyst seems to be effective at spotting firms utilizing AI across a broad range of applications. While we do not expect perfection, this approach results in a far more nuanced (and less gullible) analysis than simpler methods such as keyword search.
AI Adoption
In general, there are three ways to invest in the “gold rush” accompanying a tech boom. We list them below along with examples from the Internet boom.
⚒️ Infrastructure (“picks and shovels”) - Cisco, VeriSign
🧑💻 Digital Natives (“gold miners”) - Amazon, Pets.com
🏭 Legacy Fast Followers - Progressive, Estée Lauder
In Digitizing the Old Economy (Mar 2023), we showed that these groups correspond to Innovators, Early Adopters and Early Majority in the classic model of tech diffusion.
Exhibit 21
Crossing the Chasm

Source: Geoffrey Moore, Sparkline.
The next exhibit tracks the growing number of AI stocks identified by our AI analyst. In line with our diffusion model, the list was first dominated by infrastructure providers, such as Google and Nvidia. Over time, we saw adoption by digital natives and then finally legacy fast followers.
Exhibit 22
AI Corporate Adoption

Source: SEC, OpenAI, S&P, Sparkline. Count of stocks positioned to benefit from the rise of AI based on our AI analyst. Company logos shown for illustrative purposes. From 1/1/2010 to 6/30/2023.
In the next exhibit, we backtest the performance of AI stocks. These AI pioneers beat the market by a large margin. Although they gave up some of their outperformance in 2021 and 2022, they are getting back on track this year.
Exhibit 23
AI Stock Backtest

Source: SEC, OpenAI, S&P, Sparkline. Universe is the top 1,000 U.S. stocks by market cap. Strategy consists of stocks positioned to benefit from AI based on their most recent 10-K and four earnings calls. Returns shown relative to an equal-weighted portfolio of all stocks. Simulation does not include transaction or shorting costs or fees. See important backtest disclosure. From 1/1/2015 to 6/30/2023.
While this performance is impressive, AI was a less obvious theme for much of this period. The next exhibit shows the valuations of AI stocks relative to the market. In 2015, AI stocks traded at parity with the market. However, over time, investors pushed AI valuations to a 45% premium. While this AI premium may be justified, more richly-priced AI stocks require more careful attention be paid to valuations.
Exhibit 24
Rising AI Premium

Source: SEC, OpenAI, S&P, Sparkline. Premium is the average of nine metrics: EBITDA/EV, P/S, P/E, P/B, P/FCF, where the last four metrics are computed twice, once with the denominator computed over the trailing 12 months and again with analyst forward estimates. From 1/1/2015 to 6/30/2023.
Simply buying all AI stocks might have worked when AI exposure was free, but the market now broadly recognizes the potential of AI. That said, we believe there is still a lot of opportunity in the dispersion within AI stocks. While some are now overpriced, many continue to be undervalued.
Undervalued AI Stocks 💎
Our study of the dot-com bubble taught us that valuation is essential for navigating hype cycles. While Internet stocks as a whole experienced a roundtrip in relative returns, this was entirely due to the expensive half of Internet stocks. The cheap half outperformed consistently through the cycle.
As before, we select the most attractive 50% of AI stocks on Intangible Value. The next exhibit shows some holdings.
Exhibit 25
Undervalued AI Stock Examples

Source: SEC, OpenAI, S&P, Sparkline. For illustrative purposes only. As of 6/30/2023.
The strategy holds a mix of infrastructure, digital natives, and legacy fast followers. While stocks like Amazon and Adobe might seem expensive on traditional valuation ratios, they remain compelling on Intangible Value. Conversely, stocks like Cigna and IBM are unloved by the market but possess hidden intangible value, including in AI innovation.
The next exhibit organizes the portfolio by industry within the technological diffusion framework.
Exhibit 26
Industry Composition

Source: SEC, OpenAI, S&P, Sparkline. As of 6/30/2023.
The portfolio is spread across the three major groups. In contrast to many popular AI funds, infrastructure is actually the smallest group, accounting for only 14%. The bulk of the pie consists of more reasonably priced “users” of AI, with digital natives at 52% and legacy fast followers at 34%.
In Digitizing the Old Economy (Mar 2023), we made the case for legacy fast followers. Firms like JPMorgan can leverage incremental AI gains over large customer bases. Legacy firms also possess vast troves of proprietary data that have been underutilized due to the challenges of unstructured data. AI provides the key to unlocking this value. We believe this potential is mostly underpriced by the market.
As in the dot-com study, we compare the valuations of our cheap AI stocks to their more expensive peers. Cheap AI Stocks are a bit more attractive on traditional value and much more attractive on Intangible Value.
Exhibit 27
AI Stock Valuations

Source: S&P, USPTO, LinkedIn, SEC, OpenAI, Sparkline. All calculations are weighted averages with weights equal to position size. Patents and PhDs are calculated over a trailing 12-month window. All other metrics except price are analyst forward estimates. S&M is sales and marketing. *Patents and PhDs are scaled by billions (e.g., # patents per $1 billion market cap). As of 6/30/2023.
Finally, let’s take a look at the backtest. The next exhibit shows the returns of the cheap and expensive halves of the AI stock universe compared to those of the market.
Exhibit 28
Cheap and Expensive AI Stocks

Source: SEC, OpenAI, S&P, Sparkline. Universe is the top 1,000 U.S. stocks by market cap. AI Stocks are those considered to be positioned to benefit from AI based on their most recent 10-K and four earnings calls. Cheap (Expensive) AI Stocks are AI stocks in the top (bottom) half of intangible value. Returns shown relative to an equal-weighted portfolio of all stocks. Simulation does not include transaction or shorting costs or fees. See important backtest disclosure. From 1/1/2015 to 6/30/2023.
Cheap AI Stocks performed remarkably well, even through the 2021-2022 growth selloff. This selloff was mainly due to the repricing of overhyped growth stocks (including AI stocks) as the pandemic subsided. By avoiding Expensive AI Stocks, investors benefited from secular AI-driven growth without getting caught up in the growth stock hype cycle.
As in the dot-com bubble, Intangible Value once again provides a useful defensive measure against repricings. We believe that this will serve us especially well if today’s AI froth inflates into a full-fledged bubble in the future.
For robustness, we also backtest a sector-neutral version of the Cheap AI strategy to ensure that its outperformance isn’t merely an artifact of being structurally long tech, semis, or another sector. If anything, its performance appears even more consistent once we remove industry biases.
Exhibit 29
Cheap AI Stocks, Sector-Neutral

Source: SEC, OpenAI, S&P, Sparkline. Universe consists of the top 1,000 U.S. stocks by market cap. AI Stocks are those considered to be positioned to benefit from AI based on their most recent 10-K and four earnings calls. Cheap AI Stocks are AI stocks in the top half of intangible value. Strategy is long Cheap AI Stocks and short all stocks within each GICS sector. Simulation does not include transaction or shorting costs or fees. See important backtest disclosure. From 1/1/2015 to 6/30/2023.
Ground Truth 🧭
One of the unique challenges of hype cycles is that firms are often tempted to exaggerate their involvement in the latest tech trends. We have seen this play out with companies rushing to change their names to include “.com” in 2000, “blockchain” in 2021, and now “AI” in 2023!
In Digitizing the Old Economy (Mar 2023), we argued that human capital data can provide a helpful check on corporate “tech-washing.” For firms to invest the premium wages required to attract highly sought-after AI employees, they must be committed to the technology.
This paper included the following exhibit, which tracks the diffusion of AI talent through the economy based on the share of tech job postings mentioning terms like “artificial intelligence” or “machine learning.”
Exhibit 30
The Expanding Reach of AI 🤖

Source: LinkUp, S&P, FTSE, Crunchbase, Sparkline. As of 1/31/2023.
The current wave of AI innovation began several years ago at tech giants, such as Google and Nvidia. Next, recognizing the potential of AI, digital natives started recruiting talent to bring it into their markets. Now, as AI talent becomes more plentiful and use cases more obvious, AI is permeating the old economy. Thus, job postings validate the pattern of AI adoption found in corporate communications (Exhibit 22).
The paper also examined the returns of old economy firms employing a high share of AI workers based on data from LinkedIn. These AI-intensive employers outperformed their laggard peers, both on a market- and sector-neutral basis. This confirms our earlier finding that AI is not only helpful for tech companies but also those in the traditional economy.
Exhibit 31
Old Economy Firms Employing AI Workers

Source: S&P, FTSE, Crunchbase, LinkedIn, Sparkline. Universe is Russell 1000 Old Economy stocks. Simulation does not include transaction or shorting costs or fees. See important backtest disclosure. As of 1/31/2023.
In Investing in Innovation (Apr 2022), we studied tech trends through the lens of patent activity. As with hiring, obtaining patents is costly and thus offers a more reliable measure of where firms are allocating actual R&D dollars. We found that AI was already a fast-growing theme years before ChatGPT.
Exhibit 32
Technological Trends 🌊

Source: USPTO, Sparkline. As of 12/31/2021.
Moreover, we built a strategy that invests in stocks with high patent-based exposure to trending technologies, such as AI. While this strategy beat the market handily since the 1970s, it suffered in boom-bust hype cycles. As in the last section, we found that filtering out expensive stocks (those with poor “innovative patent yields”) mitigated losses in tech busts.
Hiring and patent data provides a valuable defense against corporate window dressing. Our basic 10-K strategy worked well in both the dot-com bubble and today’s AI hype cycle (so far). But firms are becoming ever more sophisticated at manipulating the narrative. We believe “ground truth” data will serve as an increasingly important antidote to such machinations in the years ahead.
ETF AI Exposure
For investors seeking to bet on the rise of AI, our Cheap AI Stocks strategy provides a good starting point. However, before rushing off to get more AI exposure, investors should first evaluate how much they already have in their existing portfolios.
In the next exhibit, we calculate the AI exposure of several popular exchange-traded funds (ETFs). We break down total exposure into that coming from Cheap AI and Expensive AI.
Exhibit 33
ETF AI Exposure

Source: SEC, OpenAI, S&P, Sparkline. AI Stocks are those considered to be positioned to benefit from AI based on their most recent 10-K and four earnings calls. Cheap AI Stocks are AI stocks in the top half of intangible value. Exposure scores as of 6/30/2023 and ETF holdings as of 7/15/2023.
As a baseline, the S&P 500 (SPY) provides 42% exposure to AI stocks. However, only 20% is in Cheap AI, while 22% is in Expensive AI. This sizable allocation to Expensive AI is concerning, given the susceptibility of such stocks to suffer significant multiple compression if hype cools.
A natural candidate for avoiding overpriced stocks is the Russell 1000 Value (IWD), which buys stocks with low price-to-book ratios. Unfortunately, while IWD does avoid Expensive AI, it also avoids AI in general (i.e., 17% exposure). In Value Investing Is Short Tech Disruption (Aug 2020), we argued that value funds suffer from an implicit bet against innovation. This includes a big bet against AI innovation!
Small-cap ETFs are also underweight AI. The Russell 2000 (IWM) has a mere 9% in AI stocks. Larger firms can afford to invest more heavily in AI, justified by the higher return from leveraging it over larger proprietary datasets and customer bases. In fact, Bessen (2022) and Babina et al (2023) argue that this is a big driver of rising industry concentration.
As discussed in Intangible Value: A Sixth Factor (May 2023), investors may attempt to plug this innovation underweight using Growth ETFs like Nasdaq 100 (QQQ). Unfortunately, while QQQ offers a tempting 67% headline exposure, only 27% is in Cheap AI. Concerningly, a staggering 40% of the fund is in Expensive AI – almost twice that of the S&P! 😬
Another problem with QQQ is that over 50% of the fund is in just seven Big Tech stocks. Growth investors seeking to avoid over-concentration may consider ARK Innovation (ARKK), which achieves similar total AI exposure to the S&P 500 with only 11% in Big Tech. The problem is that ARKK has an even worse cheap-expensive split than the S&P 500, with 11% in Cheap AI and 29% in Expensive AI.
Most ETFs are poorly positioned for AI. Market and Growth ETFs are heavily invested in Expensive AI stocks, which are likely to suffer if AI hype subsides. On the other hand, Value and Small-Cap ETFs have minimal AI exposure, putting them at risk of underperformance if AI stocks soar.
As a solution, what if we simply buy High Intangible Value stocks without explicitly targeting AI? It turns out that a healthy 48% AI exposure still arises organically. This is because AI is an important theme in innovation, one of the four pillars of intangible value. Best of all, since the strategy only buys cheap stocks by definition, we get all 48% of our AI exposure from Cheap AI without any Expensive AI!
Investors who believe in the disruptive potential of AI but want to avoid overhyped stocks have two options:
✨ Swap core holdings (e.g., SPY, QQQ, IWD) for High Intangible Value, roughly doubling Cheap AI while also increasing exposure to other undervalued intangibles
🤖 Carve out a satellite allocation to pure Cheap AI Stocks, sized to achieve the desired portfolio-level AI exposure
The Future of Work
AI Job Exposure 👨🏭
“I predict that, because of artificial intelligence and its ability to automate certain tasks that in the past were impossible to automate, not only will we have a much wealthier civilization, but the quality of work will go up very significantly and a higher fraction of people will have callings and careers relative to today.”
📦 Jeff Bezos
AI is set to transform the way humans do work. While AI/ML was originally confined to structured data analysis, it is now able to perform tasks requiring creativity and even empathy. ChatGPT can craft poetry; Midjourney can draw stunning images; and GitHub Copilot can write computer code.
While the impact of Generative AI on the workforce is still uncertain, researchers have some early estimates. We follow Eloundou et al (Mar 2023), who unbundle each job into its constituent tasks and assess whether completion time can be cut in half using LLMs. They give each task a score of 100% if this reduction could be achieved with current technology and 50% if it should eventually be possible but only after future upgrades to the LLM.
Interestingly, the authors employ both human labelers and GPT-4 itself and find high agreement. We use the latter approach in the form of our AI analyst. For each of the 19,265 tasks in the O*NET database, we give our AI analyst the task description and ask it to produce an AI exposure score and explanation based on the rubric from the paper.
Below are our AI analyst’s responses for six of the 21 tasks comprising the job of “personal financial advisor.”
Exhibit 34
Financial Advisor AI Exposure

Source: O*NET, OpenAI, Eloundou et al (2023), Sparkline. As of 6/30/2023.
Our AI analyst expects LLMs to be immediately useful for generating personalized written communications for clients. With future improvements, LLMs may also be helpful for ingesting, processing, and analyzing brokerage and other financial documents. On the other hand, LLMs are poorly suited to assist with tasks requiring high-touch human interaction or complex, personalized decision-making.
Of the 21 total tasks, seven are not exposed to AI, eight are exposed pending future improvements, and six are exposed based on current LLM technology. The overall score is 47%, implying that around half of financial advisors’ day-to-day tasks could reap large efficiency gains from LLMs! 🎉
Next, we compute AI exposure scores for all 923 occupations in O*NET. Below are the most and least exposed jobs.
Exhibit 35
Job AI Exposure

Source: O*NET, BLS, OpenAI, Eloundou et al (2023), Sparkline. Since many jobs have a zero score, we show those that employ the most people based on latest BLS census data. As of 6/30/2023.
Telemarketers are the most exposed, with 100% of the tasks that constitute their jobs able to be vastly streamlined by LLMs. Tax preparers, proofreaders, and programmers are also heavily exposed. On the other hand, janitors, truck mechanics, short-order cooks, and brickmasons are unlikely to be affected by the advent of LLMs in the near term.
The next exhibit aggregates this data, showing the average AI exposure for the 22 major O*NET occupational groups.
Exhibit 36
Occupational Group AI Exposure

Source: O*NET, BLS, OpenAI, Eloundou et al (2023), Sparkline. Average is weighted based on employment count from latest BLS census data. As of 6/30/2023.
White-collar jobs are the most exposed to Generative AI. This includes not only clerical roles but also knowledge workers, such as scientists, lawyers, and managers. Pending further advances in robotics, manual jobs are unaffected for now.
We next show the share of the workforce exposed to varying degrees of LLM automation. We obtain similar results to Eloundou et al, who find “around 80% of the U.S. workforce could have at least 10% of their work tasks affected by the introduction of LLMs, while approximately 19% of workers may see at least 50% of their tasks impacted.”
Exhibit 37
Workforce Disruption

Source: O*NET, BLS, OpenAI, Eloundou et al (2023), Sparkline. X-axis is the cumulative share of the US workforce that is exposed to LLM automation. As of 6/30/2023.
In A Human View of Disruption (Feb 2021), we introduced a framework by Autor et al (Nov 2003) that splits workers into a 2x2 matrix based on manual vs. cognitive and routine vs. non-routine dimensions. Since the 1980s, tech automation has mostly affected routine jobs, both cognitive and manual. This has led to polarization, as the remaining jobs are either high-income knowledge work or low-income service work.
Exhibit 38
Job Matrix

Source: Sparkline.
Unlike in previous waves of automation, Generative AI is now expected to have the greatest impact on high-skilled “cognitive non-routine” jobs like software engineers and graphic designers. Previously safe, knowledge workers are now in the crosshairs of automation!
Of course, AI exposure is not necessarily bad for workers. Its effect depends on if AI serves as a substitute or complement to labor. AI could increase productivity (and hence wages) if it improves the task mix by automating low-value tasks, allowing workers to focus on higher-value work. Conversely, it may hurt workers who have the high-value parts of their jobs automated or are inept at the non-automatable tasks.
Moreover, AI may have many second-order effects on labor demand. Boosts to productivity often lead to higher demand for labor. The number of bank tellers actually increased after the invention of the ATM, in part driven by an increase in bank branches due to their now lower cost. In addition, new jobs will emerge, whether consisting of entirely novel tasks or repackagings of existing ones. Finally, higher incomes may boost overall consumption, driving up labor demand.
Firm Workforce AI Exposure
In A Human View of Disruption (Feb 2021), we argued that a firm could be viewed as a bundle of the tasks performed by its employees. Thus, another way to quantify a company’s AI exposure is by aggregating the exposure of the thousands of worker-tasks completed by their employees each day.
To do this, we need data on firms’ workforce composition. In Digitizing the Old Economy (Mar 2023), we introduced job posting data from LinkUp, which contains millions of posts scraped directly from employer websites. We assign each job an exposure score based on its O*NET-SOC code and roll up to the firm level, an approach similar to Eisfeldt et al (May 2023). The next exhibit shows an example for Ford Motor Co.
Exhibit 39
Ford AI Exposure

Source: O*NET, LinkUp, OpenAI, Eloundou et al (2023), Sparkline. From 7/1/2022 to 6/30/2023.
Designing and manufacturing cars requires a diverse mix of cognitive and manual workers. Ford’s top two jobs, software developers and industrial engineers, are relatively exposed at ~50%. In contrast, automotive technicians, whose manual jobs are insulated from AI, are only 2% exposed. On average, a moderate 43% of Ford worker-tasks are exposed to AI.
Let’s repeat this exercise for the 1,000 largest U.S. public companies. The next exhibit shows the top and bottom employers by workforce AI exposure.
Exhibit 40
Employer AI Exposure

Source: O*NET, Linkup, OpenAI, Eloundou et al (2023), Sparkline. Universe is the top 1000 U.S. stocks by market cap. For illustrative purposes only. Based on job postings from 7/1/2022 to 6/30/2023.
H&R Block has the highest exposure at 79%. Its workforce consists mostly of tax preparers with 92% AI exposure. Other highly exposed firms are in HR, payroll, tech, or finance. On the opposite extreme, Chipotle, which mainly employs fast- food workers, has only a 9% score. The least exposed firms appear to be restaurants, retailers, or heavy industrials.
The plot below confirms this industry bias. Not only are tech and financial firms the most exposed to LLMs on average, but their scores fall in a narrow range. Retail and consumer firms are less exposed on average, but this is less meaningful due to the large dispersion across individual firms.
Exhibit 41
AI Exposed Industries

Source: O*NET, LinkUp, OpenAI, Eloundou et al (2023), Sparkline. Universe is the top 1000 U.S. stocks by market capitalization. Based on job postings from 7/1/2022 to 6/30/2023.
Unlike for the workers themselves, employers with high workforce AI exposure clearly stand to benefit. First, they could lay off workers and replace them with cheaper LLMs. Alternatively, they could use AI to augment their workforce, making their existing employees more productive. In other words, LLMs can help both increase revenues and cut costs.
However, while AI may be helpful in aggregate, not all firms will benefit. Some may have built up expertise in a particular task that is disrupted by AI (e.g., a firm with a competitive edge in low-end copywriting may see this advantage leveled). Others may simply fail to seize the opportunity due to poor management or other structural issues.
Technological disruption tends to reshuffle the competitive landscape, as early adopters leverage new innovations to beat out stagnant competitors. It follows that industries with high workforce AI exposure (e.g., tech and finance) will be especially fertile hunting grounds for investors seeking to profit from AI-led disruption in the years ahead.
Conclusion: AI Playbook
As the Age of AI dawns, investors will be presented with many exciting opportunities. However, based on studies of past technological revolutions, investors must remain wary of the runaway hype that accompanies innovation.
Below, we lay out four rules for navigating the wonderful but perilous markets that accompany major technological shifts.
🏄Be nimble. We are still in the early innings. In the coming years, the opportunity set will expand as new AI stocks enter the public markets and legacy firms pivot to AI. Be patient and stay liquid to take advantage of future opportunities. Conversely, be willing to sell holdings that lose traction or become overvalued.
🤖Be data-driven. In a market dominated by hype, use objective, hard data to uncover firms that are making real investments in AI. This requires the use of unstructured data, which, due to advances in AI itself, can now be processed efficiently using LLMs.
💎Be value-oriented. Beware of highly-valued stocks. In the dot-com bust, losses were entirely driven by expensive Internet stocks; avoiding these stocks led to consistent outperformance through the boom-bust cycle. Intangible Value metrics allow us to apply value investing to modern firms, such as those applying AI innovations.
🧺Be diversified. In periods of technological disruption, picking winners is especially hard. Putting all your money in AOL did not work out. Spread your bets to avoid missing winners. The long tail of early adopters may offer a less crowded way to diversify beyond obvious AI frontrunners like Nvidia or Microsoft.
We hope these four rules serve as helpful guiding principles for investors aiming to prosper in the Age of AI. Thanks for reading and we wish you great success in your investing!
Disclaimer
This paper is solely for informational purposes and is not an offer or solicitation for the purchase or sale of any security, nor is it to be construed as legal or tax advice. References to securities and strategies are for illustrative purposes only and do not constitute buy or sell recommendations. The information in this report should not be used as the basis for any investment decisions.
We make no representation or warranty as to the accuracy or completeness of the information contained in this report, including third-party data sources. This paper may contain forward-looking statements or projections based on our current beliefs and information believed to be reasonable at the time. However, such statements necessarily involve risk and uncertainty and should not be used as the basis for investment decisions. The views expressed are as of the publication date and subject to change at any time.
Backtest Disclosure
The performance shown reflects the simulated model performance an investor may have obtained had it invested in the manner shown but does not represent performance that any investor actually attained. This performance is not representative of any actual investment strategy or product and is provided solely for informational purposes.
Hypothetical performance has many significant limitations and may not reflect the impact of material economic and market factors if funds were actually managed in the manner shown. Actual performance may differ substantially from simulated model performance. Simulated performance may be prepared with the benefit of hindsight and changes in methodology may have a material impact on the simulated returns presented.
The simulated model performance is adjusted to reflect the reinvestment of dividends and other income. Simulations that include estimated transaction costs assume the payment of the historical bid-ask spread and $0.01 in commissions. Simulated fees, expenses, and transaction costs do not represent actual costs paid.
Index returns are shown for informational purposes only and/or as a basis of comparison. Indexes are unmanaged and do not reflect management or trading fees. One cannot invest directly in an index. The S&P 500 is a popular gauge of large-cap U.S. equities that includes 500 leading companies. The Russell 1000 Index consists of the approximately top 1000 U.S. stocks by market cap. The Russell 1000 Value (Growth) Index includes those Russell 1000 companies with lower (higher) price-to-book ratios and expected and historical growth rates.
No representation or warranty is made as to the reasonableness of the methodology used or that all methodologies used in achieving the returns have been stated or fully considered. There can be no assurance that such hypothetical performance is achievable in the future. Past performance is no guarantee of future results.