Sparkline Analytics: A New Lens

Updated: Sep 8
September 2026
Executive Summary
Sparkline Analytics is a new fund-analysis platform that pairs proprietary measures from our research with screening, diligence, and portfolio tools across a universe of over 10,000 ETFs and mutual funds. We use it to examine two investment questions: how to diversify away from the crowded AI infrastructure trade without retreating into AI laggards, and how to modernize value and factor portfolios for the intangible economy. Each exhibit links to an interactive version in the app, so readers can adapt the analysis to their own portfolios.
Introduction
Studies in Dark Matter 🔮
Since 2019, Sparkline Capital has published thirty research papers exploring many facets of the sprawling intangible economy, with studies ranging from brand and innovation to human capital and corporate culture.
Exhibit 1
Sparkline Research Library

Source: Sparkline.
Our fascination with intangible assets stems from their role as the “dark matter of finance”: economically important but largely invisible to conventional accounting. Our research rests on the belief that modern data and tools, including large language models, can help quantify the intangible capital that increasingly drives corporate value yet remains mostly absent from balance sheets and traditional valuation metrics.
Over the years, we have assembled dozens of datasets designed to measure intangible value. For example, we mapped a century of innovation using patent archives, tracked employee talent flow using labor market data, and quantified firms’ brand capital using trademarks and social media.
While these metrics have long powered our investment process, we lacked a fair and practical way to share them with readers. Meanwhile, conversations with clients reinforced the need for more capable fund-diligence tools with broader coverage of the intangible economy. This summer, we found a way to address both.
From Research to Application 🔭
The result is Sparkline Analytics, a self-service fund-analysis platform designed both as a companion to our research and as a practical tool for investors conducting fund diligence and building portfolios of ETFs and mutual funds.
Exhibit 2
Sparkline Analytics Landing Page

Source: Sparkline. View in Sparkline Analytics.
The platform brings together standard data on performance, holdings, and sectors; proprietary measures developed in our research, including intangible value, AI adoption, and trade exposure; and analytical tools, such as screeners, pivot tables, factor regressions, and portfolio builders.
In this paper, we use the platform to answer two investment questions: how to diversify away from the crowded AI infrastructure trade without retreating into AI laggards, and how to modernize value and factor portfolios for the intangible economy.
🔗Interactive Exhibits: Throughout the paper, exhibits link to interactive versions in Sparkline Analytics. Each link preserves the funds, filters, dates, and settings used in the paper, allowing readers to inspect the results and test alternatives for themselves. While the app’s data continue to update, the exhibits in this paper are static screenshots as of August 31, 2026, unless otherwise noted.
AI Infrastructure Crowding
AI Infrastructure Unwind 📉
Over the past few years, an unprecedented AI investment boom has fueled extraordinary gains for AI infrastructure stocks, particularly semiconductor firms such as Nvidia and SK Hynix. Beginning last year, however, the semiconductor rally went from extraordinary to parabolic, with the iShares Semiconductor ETF (SOXX) surging 240% in five quarters.
Exhibit 3
Semiconductor Surge

Source: Sparkline. View in Sparkline Analytics.
Although semiconductors posted the most extreme gains, momentum-driven traders piled into AI infrastructure stocks more broadly. Hedge funds led the charge, riding the wave to strong profits. By midsummer, Goldman Sachs reported that hedge fund leverage and crowding in AI infrastructure names had reached all-time highs.
In July, the trade unwound. Falling prices forced hedge funds to rapidly cut leverage. Goldman’s Hedge Fund VIP Index, a basket of popular hedge fund longs, suffered its worst monthly underperformance in over twenty years. The selloff bottomed when Situational Awareness, a once $45 billion hedge fund, was forced to sell off its public equities book, consisting of highly leveraged AI infrastructure bets.
Exhibit 4
Semiconductor Drawdown

Source: Sparkline. View in Sparkline Analytics.
While AI infrastructure stocks have recovered somewhat from their July lows, the episode illustrates the inherent risk of investing in a crowded trade. Despite the de-grossing, Goldman’s data show that hedge fund leverage and crowding in these stocks remain elevated.
Different Funds, Same Trade 🩻
AI fever has consumed more than just hedge funds. Our peer taxonomy organizes the universe of more than 10,000 ETFs and mutual funds into 127 distinct peer groups. One such group consists of AI thematic funds, identified from their prospectus text. Relative to assets, it has enjoyed the highest inflows of any equity peer group over the past three years.
Exhibit 5
Net Inflows by Peer Group

Source: Sparkline. View in Sparkline Analytics.
Over the past year, the AI composite produced a 53% return, placing it in the 97th percentile of equity funds. While ETFs and mutual funds are only a small slice of the AI trade, they have one big advantage: their complete holdings are public. A quick top holdings look-through hints at what these self-described AI funds actually own – the top ten holdings are all either chipmakers or hyperscalers.
Exhibit 6
AI Thematic Peer Group

Source: Sparkline. View in Sparkline Analytics.
An exposure analysis confirms this across the full portfolio, revealing 39% exposure to semiconductors and semicap equipment and 17% to the Magnificent 7. After adding AI-linked hardware, data center, power, and utility stocks – and removing overlaps across categories – total AI infrastructure exposure reaches 69%. In practice, the AI trade has largely become a big bet on AI infrastructure.
Exhibit 7
AI Funds: Sector and Thematic Exposure

Source: Sparkline. View in Sparkline Analytics (Sector Exposure | Thematic Exposure).
This convergence also shows up in returns. The next exhibit measures rolling correlations against SOXX, using returns in excess of the S&P 500, proxied by the SPDR S&P 500 ETF (SPY), to remove the common market factor. AI funds’ semiconductor correlation has climbed to an all-time high of 87%. The Goldman Sachs Hedge Industry VIP ETF (GVIP), which tracks the Hedge Fund VIP Index from earlier, has converged on the same driver, with a 76% correlation.
Exhibit 8
Converging on Semiconductors

Source: Sparkline. View in Sparkline Analytics.
The iShares MSCI Emerging Markets ETF (EEM) has also seen its correlation with semiconductors jump from zero to 68% over the past year, reflecting rising concentration in Asian AI infrastructure suppliers like TSMC, Samsung, and SK Hynix.
AI Infrastructure Overload 🥵
But here’s the thing: most investors already own plenty of AI infrastructure. The massive market capitalizations of these firms give them substantial weights in broad U.S. indexes – dedicated AI funds just add a second helping.
The next exhibit compares AI infrastructure exposure across the S&P 500, Nasdaq 100 (QQQ), and AI peer group. The S&P 500 – many investors’ default stock market allocation – has a considerable 48% exposure. That figure rises to 68% for the Nasdaq 100 and 69% for thematic AI funds.
Exhibit 9
AI Infrastructure: Lots, More, or Even More?

Source: Sparkline. View in Sparkline Analytics.
AI infrastructure overload has developed rapidly as the AI boom has unfolded. Over the past seven years, the S&P 500’s AI infrastructure weight nearly doubled from 25% to 48%.
Exhibit 10
S&P 500 AI Exposure (2019 vs. Today)

Source: Sparkline. View in Sparkline Analytics.
In Surviving the AI Capex Boom (Oct 2025), we expressed concern over the sustainability of the AI investment boom. Historical technological buildouts, such as the 1860s railroad and 1990s Internet deployments, have almost always been accompanied by capital cycles, in which infrastructure firms overbuild and suffer when profits are slow to materialize.
Exhibit 11
Capital Cycle Schematic

Source: Chancellor (2015). Reproduced from Surviving the AI Capex Boom (Oct 2025).
Today, the hyperscalers are committing trillions of dollars to the AI buildout, leading to record profits for chipmakers and other downstream infrastructure providers. However, as hyperscaler free cash flows dwindle, the buildout is increasingly reliant on debt, equity, and vendor financing, as well as large contractual commitments from a small number of still-unprofitable model developers.
In essence, the entire AI infrastructure complex – and, to a meaningful extent, the broader stock market – hinges on the continuation of unprecedented AI capital spending. With Magnificent 7 capital expenditures approaching 30% of revenue, the pressure for AI to generate enough broad-based economic value to sustain this spending is mounting.
Exhibit 12
Magnificent 7 Capex

Source: Sparkline. View in Sparkline Analytics.
Beyond Picks and Shovels
How can investors diversify away from the AI infrastructure concentration of the S&P 500 and other U.S. stock indexes?
One obvious approach is to hide in alternative indexes, such as traditional value (IWD), equal-weighted (RSP), developed international (EFA), or small-cap (IWM) stocks. While these alternatives reduce AI infrastructure exposure, they arguably go too far to the opposite extreme, instead concentrating in “AI laggards” – slow-moving firms that risk missing out on the AI revolution altogether.
Exhibit 13
Laggard Nation

Source: Sparkline. View in Sparkline Analytics.
IWD, RSP, EFA, and IWM are weighed down by 41% to 83% in AI laggards. Meanwhile, emerging markets sit on the other side of the trade-off. With much of the AI supply chain running through Taiwan and South Korea, EEM has 53% exposure to AI infrastructure – even more than the S&P 500.
In AI Adopters: Beneficiaries of the Boom (Jan 2026), we advocated for a third option: AI early adopters – non-infrastructure firms across industries whose earnings calls, job postings, and patents show meaningful AI deployment and growing evidence of measurable AI-driven returns.
Unlike infrastructure firms, early adopters do not bear the large capital costs of the buildout. However, they still stand to benefit if the technology turns out to be successful, as AI-enabled adopters should enjoy a significant competitive advantage over slower-moving rivals.
Historically, while infrastructure builders tend to outperform at the start of a capital cycle, early adopters have often been the long-term winners. Furthermore, in the event of a dot-com-style crash, early adopters often capture much of the consumer surplus created by overbuilt infrastructure.
The AI Adopter-Infrastructure Frontier 🤠
This suggests another, less obvious way to gain AI exposure: funds with high adopter exposure but low infrastructure and laggard exposure. Using the screener, we filter for funds with more than 33% weight in early adopters and less than 33% in each of infrastructure and laggards.
The resulting group of 111 funds looks nothing like the standard AI trade. With only 7% in semiconductors and 10% capex intensity, these funds own the companies adopting AI rather than the ones building it.
Exhibit 14
AI Adopters with Low Laggards and Infrastructure

Source: Sparkline. View in Sparkline Analytics.
Using the screener’s visualization tool, we plot these funds as blue dots on a scatterplot with infrastructure and adopter axes. For reference, we include gray dots representing the parent universe of all diversified equity funds and orange markers for the familiar indexes from Exhibit 13.
Exhibit 15
AI Adopter vs. Infrastructure Frontier

Source: Sparkline. View in Sparkline Analytics.
The blue dots trace the adopter-heavy upper half of the “adopter vs. infrastructure frontier,” the outer edge of the cloud after laggard exposure has been squeezed out. In principle, AI’s economic gains should accrue somewhere on this frontier – either as profits to builders or productivity gains to adopters.
Investors have a choice of where on the frontier to sit. Most sit on its lower half, either through explicit bets on recent AI winners or implicitly through market-cap-weighted indexes. And the money is still moving that way, with the lower half drawing several times the inflows of the upper over the past three years. We believe the adopter-heavy upper half offers a less crowded way to gain AI upside while also mitigating capital cycle risk.
Modern Factor Portfolios
Value’s Lost Decade 😢
The prior AI analysis raises an important question: why do traditional value funds cluster among the AI laggards?
We believe that value funds’ concentration in AI laggards reflects a broader anti-innovation bias. Value funds tend to hold not only fewer AI adopters but also fewer innovative firms in general, with lower R&D and researcher intensity. Moreover, they often eschew modern, asset-light businesses in favor of old-economy firms with lower capital efficiency.
Exhibit 16
Value’s Anti-Innovation Bias

Source: Sparkline. View in Sparkline Analytics.
In Value Investing Is Short Tech Disruption (Aug 2020), we argued that value’s implicit bet against innovation explained its recent struggles. From 1963 to 2007, the Fama-French value factor (HML), which buys stocks with low price-to-book ratios and sells the opposite, outperformed by 5.8% per year. However, it has been in a prolonged drawdown since.
Exhibit 17
Fama-French Value Factor

Source: Sparkline. View in Sparkline Analytics.
This problem is not merely academic but has cost investors real money. Since 2007, the iShares Russell 1000 Value ETF (IWD) has underperformed the S&P 500 by 39%. Moreover, the IWD investor experience is not unique. The broader US Large Value peer group, of which IWD is a member, has had similar returns over this period.
Exhibit 18
Value Fund Drawdown

Source: Sparkline. View in Sparkline Analytics.
In Intangible Value (Jun 2021), we argued that value’s anti-innovation bias was the result of its reliance on outdated accounting metrics that omit intangible capital, penalizing not only innovators but any asset-light business built on brands, human capital, or network effects.
To address this deficiency, we built an “intangible value factor.” It follows the Fama-French methodology, but rather than defining intrinsic value solely as tangible book value, it also incorporates intangible capital. In simulation, we found that this augmented metric would have continued to outperform even as its counterpart struggled after 2007.
This intangible adjustment helps correct traditional value’s anti-innovation bias. Funds with high intangible value also have more AI adopters, new-economy firms, and disruptors. They also offer higher R&D and researcher intensity, as well as improved capital efficiency. This suggests that intangible value can serve as a useful complement to traditional value.
Exhibit 19
Intangible Value’s Pro-Innovation Bias

Source: Sparkline. View in Sparkline Analytics.
A New Factor Lens 🔬
In Intangible Value: A Sixth Factor (May 2023), we ran with this idea, proposing intangible value as a complementary “sixth factor” alongside not only traditional value but also other widely used academic factors like small-cap, quality, and momentum.
Exhibit 20
Factor Universe

Source: Sparkline. Reproduced from Intangible Value: A Sixth Factor (May 2023).
Quantitative research finds that all six factors have delivered positive long-term historical returns. Importantly, they have behaved as distinct factors with generally low correlations. Together, these findings suggest that combining them into a multifactor portfolio can improve risk-adjusted returns.
Exhibit 21
Factor Correlation Matrix
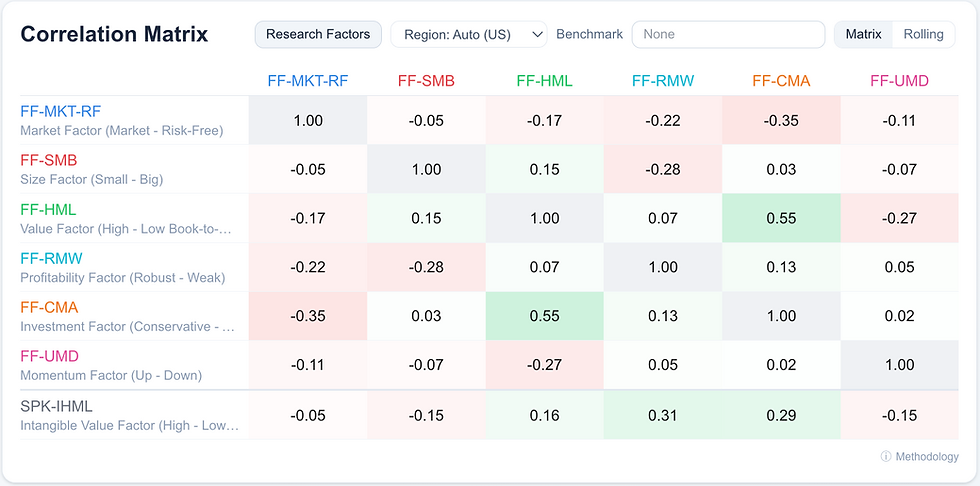
Source: Sparkline. View in Sparkline Analytics.
To translate this academic point into practical portfolios, Sparkline Analytics reports holdings-based factor scores across the equity-fund universe, scoring each fund based on the characteristics of its underlying stock holdings, rather than inferring exposures from past returns. The next exhibit compares three familiar factor funds using this lens.
Exhibit 22
Holdings-Based Factor Scores

Source: Sparkline. View in Sparkline Analytics.
The iShares MSCI USA Quality Factor ETF (QUAL) and iShares MSCI USA Momentum Factor ETF (MTUM) provide exposure to the quality and momentum factors, respectively. The Avantis U.S. Small Cap Value ETF (AVUV) offers exposure to both traditional value and small-cap. Given the recent rally in value stocks, it also carries positive momentum exposure.
The “Factor Details” card provides a drill-down into many of the components of the composite factor scores. In the next exhibit, we show how these three funds score on a handful of underlying metrics – both relative to each other and to the full distribution of U.S. equity funds’ scores.
Exhibit 23
Factor Details

Source: Sparkline. View in Sparkline Analytics.
Consistent with their composites, AVUV owns cheap firms with an average price-to-book ratio of just 1.5, QUAL features firms with a robust 51% average return on equity, and MTUM holds stocks that have enjoyed an average one-year return of 126%. However, all three are only middling on intangible value, including the innovation/IP measures shown here.
This card also connects back to our earlier AI analysis. MTUM is heavily invested in the AI infrastructure trade, while AVUV concentrates in AI laggards – its 88% laggard weight is even greater than the 82% average of its small-cap value peers.
The above approach computes factor exposures based on funds’ current holdings. Sparkline Analytics also offers a second, complementary lens: calculating factor loadings from historical returns. Below, we apply this second lens to the same three funds, as well as two other factor funds: IWD and the Dimensional U.S. Marketwide Value ETF (DFUV).
Exhibit 24
Factor-Fund Regression

Source: Sparkline. View in Sparkline Analytics.
This returns-based lens corroborates our earlier holdings-based analysis. As before, QUAL loads on quality (RMW), MTUM on momentum (UMD), and the value funds on traditional value (HML). AVUV combines traditional value (HML) and small-cap (SMB), along with a secondary exposure to quality (RMW).
We also see some important differences. For example, AVUV holds high-momentum stocks today, but has historically had a minimal loading on the factor. Similarly, MTUM currently owns highly profitable AI infrastructure firms, but historically has actually loaded negatively on the quality factor.
Hidden Factor Bets 🕵️
Are factors only for quants? Why should normal investors care about their hidden machinations?
Despite being a bit arcane, factors explain more of fund performance than most investors realize. The past three years offer an illustrative case study. Over this period, the momentum factor returned 40% while the quality factor fell 14%. Any fund with a persistent tilt toward either one inherited a boost or drag to its returns.
Factor attribution makes these exposures visible, restating a fund’s return as the sum of its loading on each factor times that factor’s return, plus whatever is left over, which is alpha.
Exhibit 25
Factor Attribution

Source: Sparkline. View in Sparkline Analytics.
Over this period, SPY returned 44% over cash, nearly all of it from its market exposure. GVIP, the basket of hedge fund favorites from earlier, earned 57%, beating the market by 13 percentage points. However, most of its outperformance can be attributed to its positive momentum tilt, which added 10 points to returns. After stripping out factor exposures, these hedge fund favorites actually had -4 points of alpha.
Similarly, the VanEck Social Sentiment ETF (BUZZ) beat the market by 28 percentage points. In contrast to GVIP, the fund buys stocks that retail investors are talking about – which tend to be high-beta and unprofitable. Both tilts contributed to outperformance, with its 1.4 beta adding 17 points and its negative quality loading adding 13 points.
The factor lens can also help explain laggards. VanEck’s Wide Moat ETF (MOAT) earned only 23%, trailing the index by 21 points. However, most of this shortfall was due to its negative momentum tilt, which detracted 16 points from returns, with its lower market beta costing another 5 points.
The next exhibit shows the cumulative return contribution of momentum for these funds. The factor has had a strong run, especially in the chip rally earlier this year. This has been a boon for trend-following funds like GVIP but a headwind for those like MOAT that tend to own out-of-favor stocks.
Exhibit 26
Momentum Attribution

Source: Sparkline. View in Sparkline Analytics.
Factors matter for more than just these four funds. Among the ~2,400 diversified U.S. equity funds with three years of history, the top decile beat the S&P 500 by a median of 6% per year. However, once factor exposures are accounted for, only 1.4 points remain. Over the same period, the bottom decile lagged by 11% per year, but only 6 points remain after accounting for factor tilts. Much of what separated the best and worst funds was factor exposure, not stock selection.
This compounds at the portfolio level. If all of its underlying funds have the same factor bet, a portfolio inherits this shared tilt in concentrated form. For example, a portfolio spread across dividend, low-volatility, and value funds may appear diversified but actually have a large, unintentional value bet. Building factor exposures deliberately, rather than inheriting them, is the subject of the next section.
Building Factor Portfolios 🧩
An important part of fund diligence is ensuring that funds work well together in a portfolio context. Sparkline Analytics offers a “portfolio builder” embedded directly into the fund-analysis interface. As you add funds or adjust weights, the portfolio’s returns, look-through holdings, factor exposures, correlations, and all other analytics update in real time.
Let’s build a U.S. core-satellite factor portfolio. We start with a 60% allocation to a low-cost passive core, and then allocate the remaining 40% equally across four factor satellites. We use the Vanguard S&P 500 ETF (VOO) for the core and DFUV, AVUV, QUAL, and MTUM as satellites. This portfolio is illustrative, not an investment recommendation.
Exhibit 27
Model Portfolio

Source: Sparkline. View in Sparkline Analytics.
The next exhibit computes the model portfolio’s regression-based factor exposures. We include the five constituent building blocks for reference.
Exhibit 28
Model Portfolio Factor Regression

Source: Sparkline. View in Sparkline Analytics.
The portfolio enjoys positive exposure to all the standard factors – market (MKT), small-cap (SMB), traditional value (HML), quality (RMW), and momentum (UMD) – but negative exposure to intangible value (IHML). Moreover, reweighting cannot fix this, as each underlying fund has negative IHML.
Intangible Value in the Wild 🦁
None of these mainstream factor funds provides exposure to the elusive intangible value factor. Does any fund?
To find out, we build a screen using both lenses, requiring (1) a holdings-based intangible value score above 70 and (2) a positive returns-based IHML loading with a t-statistic above 1.96. We also require (3) a traditional value score above 25 to prevent the screen from simply returning growth funds that gain intangible exposure by abandoning value altogether.
We require both intangible value lenses because each has a characteristic false positive that the other catches. The holdings-based lens only describes what a fund owns today and may be unreliable for high-turnover funds. For example, the Pacer US Cash Cows 100 ETF (COWZ) passes the holdings filter today, but its returns-based loading is zero. With 86% turnover, its portfolio has rotated between tangible energy and asset-light tech stocks over the past several years.
Meanwhile, a returns-based loading can arise simply due to statistical noise. The SPDR S&P Regional Banking ETF (KRE), perhaps the definition of tangible, passes the returns-based filter today. However, its holdings-based intangible value score of only 20 quickly eliminates it.
The scatterplot below shows how the full universe of ~3,500 diversified equity funds scores on holdings-based vs. returns-based intangible value. The blue dots represent the funds that pass all three filters, while the orange dots denote COWZ, KRE, and the factor funds from earlier – all of which sit outside the blue region.
Exhibit 29
Intangible Value: Two Ways

Source: Sparkline. View in Sparkline Analytics.
The target region is small. 731 funds pass the holdings filter and 213 pass the returns filter, but only 86 pass both. This is because the fund universe itself is not neutral on intangible value but short it: 72% of funds carry a negative loading on intangible value, and 53% carry a statistically significant negative loading. By contrast, only 10% have a significant positive loading.
The final exhibit previews the screener output, with all 86 funds available through the interactive link. We find a diverse mix of actively managed value funds, quantitative factor strategies, and more niche intangible-focused products. As it turns out, intangible value does exist in the wild – you just need the right lens to find it!
Exhibit 30
Intangible Value in the Wild

Source: Sparkline. View in Sparkline Analytics.
Conclusion
Fund diligence requires looking beyond names and category labels. This paper showed that AI funds are dominated by the same infrastructure stocks that investors already own through broad indexes, while value and factor portfolios often carry an unintended bet against innovative and asset-light firms. Analyzing fund holdings and factor exposures points to two alternatives: AI adopters and intangible value.
Importantly, this analysis is reproducible and adaptable. Each exhibit links to an interactive version in Sparkline Analytics, where readers can change the funds, dates, filters, and assumptions used in the paper. The platform is also an open-architecture research tool that users can apply to specific questions about their own holdings and portfolios, as well as markets in general.
Disclaimer
This paper is solely for informational purposes and is not an offer or solicitation for the purchase or sale of any security, nor is it to be construed as legal or tax advice. References to securities and strategies are for illustrative purposes only and do not constitute buy or sell recommendations. The information in this report should not be used as the basis for any investment decisions.
We make no representation or warranty as to the accuracy or completeness of the information contained in this report, including third-party data sources. This paper may contain forward-looking statements or projections based on our current beliefs and information believed to be reasonable at the time. However, such statements necessarily involve risk and uncertainty and should not be used as the basis for investment decisions. The views expressed are as of the publication date and subject to change at any time.
Backtest Disclosure
The performance shown reflects the simulated model performance an investor may have obtained had it invested in the manner shown but does not represent performance that any investor actually attained. This performance is not representative of any actual investment strategy or product and is provided solely for informational purposes.
Hypothetical performance has many significant limitations and may not reflect the impact of material economic and market factors if funds were actually managed in the manner shown. Actual performance may differ substantially from simulated model performance. Simulated performance may be prepared with the benefit of hindsight and changes in methodology may have a material impact on the simulated returns presented.
The simulated model performance is adjusted to reflect the reinvestment of dividends and other income. Simulations that include estimated transaction costs assume the payment of the historical bid-ask spread and $0.01 in commissions. Simulated fees, expenses, and transaction costs do not represent actual costs paid.
Index returns are shown for informational purposes only and/or as a basis of comparison. Indexes are unmanaged and do not reflect management or trading fees. One cannot invest directly in an index.
No representation or warranty is made as to the reasonableness of the methodology used or that all methodologies used in achieving the returns have been stated or fully considered. There can be no assurance that such hypothetical performance is achievable in the future. Past performance is no guarantee of future results.
Interactive Exhibits
Links in this paper direct to Sparkline Analytics, an interactive data and analytics platform operated by Sparkline Capital LP. Use of the application is subject to its Terms of Service and Disclosures. Certain features require registration.
The application’s data update continuously, so interactive exhibits may differ from the static exhibits in this paper, which reflect data as of August 31, 2026, unless otherwise noted. Fund holdings in the application are sourced from public regulatory filings and reflect each fund’s most recent filing rather than its current portfolio.
Sparkline Capital LP and its affiliates manage certain funds that appear in the application. Affiliated funds are included on the same terms as all other funds: they are scored, displayed, and ranked using the identical methodology and receive no preferential treatment or placement. The inclusion of any fund – affiliated or otherwise – is not an endorsement or recommendation.