AI Disruption: Moats and Value Traps
- Kai Wu

- May 19
- 22 min read
May 2026
Executive Summary
Investors are circling as stocks at risk of AI disruption fall to discounted valuations. However, traditional value metrics struggle when applied to firms facing disruption. Long-term winners of disruption often possess key intangible assets, both technological and complementary, not captured by traditional metrics. Intangible value, which incorporates these moats, has been effective at separating disruption’s winners from value traps. Applied to the software selloff, this framework reveals not a blanket bargain but a dispersion-rich stockpicking opportunity.
Introduction
Software Apocalypse ☢️
In AI Adopters: Beneficiaries of the Boom (Jan 2026), we showed that corporate AI adoption is accelerating as firms begin realizing tangible returns on their AI investments. As early adopters ourselves, we remain bullish on this trend and the positioning of these AI-enabled firms.
But disruption creates both winners and losers. The flipside of AI adoption is that many incumbents are now selling off due to fears that AI will disrupt their business models. The AI reaper has come for wealth advisors, consultants, and even trucking firms. However, nowhere has the damage been as severe and widespread as in software stocks.
Software development is by far the most advanced AI use case today, powered by coding agents like Claude Code and Codex. In a world where software costs nearly zero to build, the market seems to believe that software firms no longer have moats. Over the past several months, software stocks have sold off, despite the broader market continuing to rally.
Exhibit 1
Software Stock Selloff

Source: S&P, Sparkline. Software represented by IGV ETF. From 4/30/2025 to 4/30/2026.
Software stocks, formerly the darlings of growth investors, are now arriving on the radars of value investors. Historically commanding premium valuations, software stocks are now trading at a roughly 10% discount to the market.
Exhibit 2
Software No Longer Trades at a Premium

Source: S&P, Sparkline. From 12/31/2007 to 4/30/2026.
Many entrenched software giants, having suffered massive drawdowns, are available at even deeper discounts. GoDaddy, Adobe, Workday, Atlassian, and Salesforce trade at forward price-to-earnings ratios below 13.5 – about half that of the market. On traditional value metrics, these look like textbook value opportunities.
Exhibit 3
Software Fallen Angels

Source: S&P, Sparkline. As of 4/30/2026.
Value Traps 🪤
However, buying stocks exposed to disruption simply on the basis of current multiples is a risky gambit. History is littered with iconic firms that appeared deceptively cheap even as disruption drove them into oblivion. Consider the tragic falls of Blockbuster, Borders, RadioShack, and McClatchy.
Exhibit 4
Iconic Disruptions

Source: S&P, Sparkline. From 1/1/2002 to 4/30/2026.
At their peaks, these firms had thousands of stores, tens of thousands of employees, millions of customers, and billions of annual revenues. However, they were ultimately driven into bankruptcy, failing to adapt to new Internet paradigms like streaming, e-commerce, and digital and social media.
Moreover, as the next exhibit shows, their stocks were classic “value traps.” As disruption risk mounted, stock prices quickly collapsed. However, revenue took years to erode – and in some cases actually rose for a period of time. Falling prices relative to lagged fundamentals created the illusion of cheapness – luring value investors onto sinking ships.
Exhibit 5
Iconic Value Traps

Source: S&P, Sparkline. Data rebased as of 1/1/2002.
We believe that much of software’s selloff has been driven by indiscriminate selling and an underappreciation of software firms’ true moats. That said, many seemingly cheap software firms are truly being disrupted. Successful investors will be those able to separate the survivors from the value traps.
History of Disruption
Measuring Disruption 🔮
In order to properly study the history of disruption, we need more than just four anecdotal examples. We’ll build on the methodology from Investing in Innovation (Apr 2022), which analyzed trending technologies in a century of patent data.
Using machine learning, we build clusters of similar patents and identify those that have been spreading across a wide swath of industries. This allows us to study the impact of broad-based technologies like AI, as opposed to industry-specific innovations such as “implantable cardiac devices.”
We then measure each industry’s exposure to these frontier technologies by analyzing the language used in documents related to constituent firms, such as company reports, earnings calls, and analyst commentary. The next table lists recent waves of disruption, along with their peak years of intensity, top patent clusters, and most exposed industries.
Exhibit 6
Recent Disruption Waves
Technology | Disruption Window | Top Patent Subcluster | Top Exposed Industry |
Internet Infrastructure | 1996-2005 | Managed Network Server Systems | Diversified Telecom Services |
Mobile & Internet-of-Things | 1997-2022 | Secure Proximity-Based Connectivity | Wireless Telecom Services |
E-Commerce | 2005-2021 | Secure Digital Commerce Transactions | Specialty Retail, Broadline Retail |
Digital Media & Streaming | 2006-2022 | Cross-Channel Targeted Digital Advertising | Media, Entertainment |
Social Media | 2009-2018 | Social Graph Analytics And Targeting | Interactive Media & Services |
Cloud Computing | 2009-2018 | Distributed Cloud and Edge Orchestration | Semiconductors, Software |
Artificial Intelligence | 2022-2026 | Applied Machine Learning Systems | Software, Semiconductors |
Source: Sparkline. As of 4/30/2026.
Starting in the 1990s, the Internet and mobile revolutions laid the foundation for a series of successive and mutually reinforcing innovations, including e-commerce, digital and social media, and cloud computing. The resulting disruption was not confined to “technology” stocks, but impacted the business models of retailers, media firms, and many others.
Importantly, disruptive waves do not occur in isolation but stack on one another. As the next exhibit shows, the retail industry was buffeted by a series of compounding disruptions – first e-commerce, then mobile, digital and social media, and now AI.
Exhibit 7
Retail Disruption Exposure by Theme

Source: Sparkline. Darker shading reflects greater retail industry disruption exposure. Total is the sum across all themes. From 12/31/1999 to 12/31/2025.
The final row depicts the total exposure across themes. In order to convert this continuous exposure score into a binary classification, we apply a fixed threshold. Each month, we consider industries “exposed” if their scores exceed this threshold; otherwise, we call them “insulated.”
Now that we have a systematic way to identify firms facing disruption, let’s revisit our original question: are periods of disruption truly more treacherous for value investors?
Value Investing Is Short Disruption 🪦
In order to model the performance of value investors, we use the widely followed “value factor,” defined as a long-short portfolio that buys cheap and sells expensive stocks based on a blend of traditional value metrics, such as price-to-earnings ratio. The next exhibit shows its performance.
Exhibit 8
The Death of Value Investing?

Source: S&P, Sparkline. Relative return of top vs. bottom tercile stocks based on a blend of price/earnings, price/sales, price/book, and price/free cash flow (both trailing and forward). Rebalanced monthly. Universe consists of top U.S. stocks summing to 97% of total market cap. No transaction or financing costs. From 12/31/1994 to 4/30/2026. See important backtest disclosure below.
Since 2010, the value factor has suffered a painful drawdown, as stocks screening cheap on traditional metrics have underperformed those appearing more expensive. This prolonged underperformance has led commentators to declare “the death of value investing.”
However, before we pronounce value dead, let’s look at the next exhibit. Using our newly built disruption classification, we divide the stock universe into “exposed” and “insulated” industries and run the value factor separately within each of these two complementary segments.
Exhibit 9
Value Investing Is Being Disrupted

Source: S&P, Sparkline. Relative return of top vs. bottom tercile stocks based on a blend of price/earnings, price/sales, price/book, and price/free cash flow (both trailing and forward). Rebalanced monthly. Universe consists of top U.S. stocks summing to 97% of total market cap. Exposed (insulated) consists of universe stocks with disruption scores greater (less) than 1. No transaction or financing costs. From 12/31/1994 to 4/30/2026. See important backtest disclosure below.
The value factor has actually worked quite well in insulated sectors, delivering consistent outperformance over the past thirty years. However, it has struggled picking stocks in exposed sectors. Since 2010, the losses from applying value in exposed sectors more than offset the gains from applying it in insulated sectors, leading the net factor to draw down. Value may not be dead – but it is being disrupted.
The failure of traditional value in exposed industries can be attributed to its unfortunate tendency to sell disruptive winners like Amazon and buy value trap losers like Borders. Isolating the returns of the long and short legs relative to the market, we find that both contributed similarly to losses.
As a final robustness check, we run additional variants of this analysis. First, we study a broader global stock universe. Second, we use a narrower definition of value: the classic price-to-book ratio. Third, we run the factor sector-neutral. Fourth, following a popular approach today, we augment the value factor with quality and momentum filters.
Exhibit 10
Robustness Check: Exposed - Insulated Returns

Source: S&P, Sparkline. Bars show annualized return of value factor (defined above) in exposed minus insulated industries. Global Stocks: rather than only U.S., run in global universe. Price/Book Only: rather than 4-metric blend, use P/B. Sector-Neutral: control for GICS sectors. Quality-Filtered: double-sort on quality and value. Momentum-Filtered: double-sort on momentum and value. No transaction or financing costs. From 12/31/1994 to 4/30/2026. See important backtest disclosure below.
Our core finding – that the value factor underperforms when applied to stocks facing disruption – remains intact in all settings. The return spread between applying it in exposed and insulated sectors is significantly negative in all cases.
For investors currently kicking the tires on software stocks, this historical analysis offers a cautionary lesson: traditional value metrics have been largely ineffective at evaluating firms facing technological disruption. Investors overly reliant on these naive metrics risk getting stuck in value traps, while missing out on the true disruptors.
In Value Investing Is Short Tech Disruption (Aug 2020), we first argued that value investors were inadvertently rotating into a massive bet against disruptive innovation, and that this losing bet explained their ongoing drawdown. Six years later, the present study offers further support of this thesis.
Disruption’s Rising Tide 🌊
Investors are currently singling out software stocks as the epicenter of today’s AI-driven selloff. However, AI is a so-called “general-purpose technology” with the potential to transform not just software but all facets of the economy.
In Investing in AI: Navigating the Hype (Jul 2023), we studied firm-level AI exposure using workforce data. We found that, in addition to software, most other technology sectors, as well as finance, healthcare, telecommunications, media, and professional services, are heavily exposed to AI. Moreover, we expect exposure to spread as AI models improve and complementary progress is made in robotics.
Exhibit 11
AI Exposure by Sector

Source: O*NET, LinkUp, OpenAI, Eloundou et al (2023), Sparkline. Universe is the top 1000 U.S. stocks by market capitalization. Based on job postings from 7/1/2022 to 6/30/2023. Reproduced from Investing in AI: Navigating the Hype (Jul 2023).
The next exhibit highlights the share of the U.S. stock market that is considered “exposed.” While technological pressure has come in waves, it has maintained an upward trend. Today, with the advent of AI, disruption has reached an all-time high: over 72% of U.S. companies representing 78% of market capitalization now face disruption.
Exhibit 12
Disruption’s Rising Tide

Source: S&P, Sparkline. From 12/31/1994 to 4/30/2026.
Over the past cycle, many value investors have survived by focusing on market segments outside of U.S. large-caps with less exposure to disruption. Unfortunately, even these other sectors face rising disruption risk, with 68% of market cap exposed in U.S. small-cap stocks, 65% in non-U.S. developed market stocks, and 52% in emerging market stocks.
While traditional value metrics have continued to work in insulated sectors, these sectors comprise a rapidly shrinking share of the stock market. Soon, value investors will have nowhere to hide from disruption’s all-seeing gaze. Adapting valuation metrics to work for firms exposed to technological change will be increasingly crucial in the age of AI.
Surviving Disruption
Intangibles and Complementary Assets ☯️
How have firms historically been able to weather the gales of disruption? The next exhibit shows two firms that survived and are now thriving: Walmart managed to successfully fend off Amazon and other e-commerce disruptors, while The New York Times avoided the decimation of the newspaper industry driven by Google, Meta, Craigslist, and others.
Exhibit 13
Walmart and The New York Times

Source: S&P, Sparkline. Not a recommendation to buy or sell securities. From 1/31/2001 to 4/30/2026.
The success of these firms is due to a combination of factors. First, they embraced the technological threats – e-commerce and digital media. Second, they leaned into their unique advantages around brand, human capital, and, to a lesser extent, network effects. In other words, they survived due to their intangible moats.
One useful way to frame these intangible moats is through the lens of “complementary assets,” a concept introduced in David Teece’s seminal paper, Profiting from Technological Innovation (1986). Teece argued that “innovating firms often fail to obtain significant economic returns from an innovation, while customers, imitators and other industry participants benefit,” as the “profits from innovation may accrue to the owners of certain complementary assets, rather than to the developers of the intellectual property.”
In other words, while the core intellectual property is clearly valuable, so too are surrounding complementary assets, such as manufacturing, distribution, sales networks, after-sales service, and other complementary technologies. In many cases, these complements end up being the scarce assets, while the innovation itself becomes commoditized.
Exhibit 14
Complementary Assets
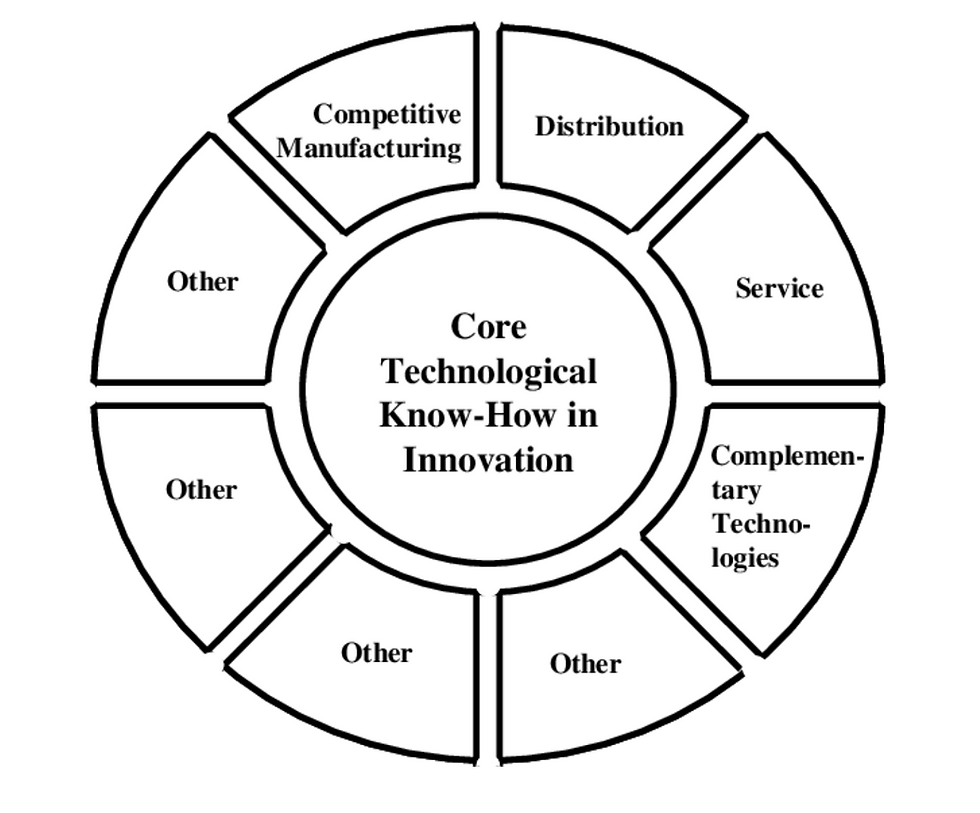
Source: Teece (1986).
Teece provides several examples of innovators that failed to profit from their innovation. EMI invented the CT scanner but lacked the enterprise sales, training, and servicing skills required to successfully sell it to hospitals. Ultimately, EMI lost to GE, which already possessed these complementary capabilities and eventually caught up on the technology.
Similarly, RC Cola was actually first to market with both canned and diet cola but struggled to make inroads without the distribution (i.e., shelf space) and global brands of Coca-Cola and Pepsi, which now dominate these markets.
In contrast, IBM was late to the personal computer market but still became the dominant leader in the 1980s. According to Teece, IBM’s success was not due to superior technology, but to the way it fostered a vibrant complementary software ecosystem – creating powerful network effects.
Exhibit 15
Innovators Do Not Always Win

Source: Teece (1986).
As we consider the present innovation of AI, it is important to recognize that the original innovators do not always win. The mythology of disruption – that fast-moving startups inevitably overtake lazy incumbents – is appealing but, as we show in the appendix, empirically unfounded. Success requires complementary assets, which often end up being even more important than the focal innovation itself.
Intangible Value ✨
In Intangible Value (Jun 2021), we introduced a modernized version of the value factor, which we called the “intangible value factor.” Unlike traditional value, intangible value incorporates not only tangible assets but also intangible assets, including intellectual property, brand equity, human capital, and network effects.
Exhibit 16
Intangible Value

Source: Sparkline. Reproduced from Intangible Value (Jun 2021).
Intangible value is highly aligned with Teece’s framework. Let’s take the case of AI, today’s focal innovation. Of course, intangible value seeks firms with AI-related IP. However, it also credits firms for innovative IP in complementary fields, such as robotics and genomics. Moreover, it seeks not only strong IP but also other complementary intangibles, including brand equity, human capital, and network effects.
The next exhibit shows the performance of the intangible value factor in the full stock universe, as well as separately in exposed and insulated industries. As before, we show the returns of a long-short portfolio that buys cheap and sells expensive stocks. However, in this case, we use intangible value rather than traditional value to define cheapness.
Exhibit 17
Intangible Value: Exposed vs. Insulated Industries

Source: S&P, Sparkline. Relative return of top vs. bottom tercile stocks based on intangible value. Rebalanced monthly. Universe consists of top U.S. stocks summing to 97% of total market cap. Exposed (insulated) consists of universe stocks with disruption scores greater (less) than 1. No transaction or financing costs. From 12/31/1994 to 4/30/2026. See important backtest disclosure below.
Since 1995, intangible value has outperformed across the full market, successfully identifying subsequent winners and losers. Like traditional value, it produced consistent excess returns in insulated industries. However, unlike traditional value, intangible value also proved an effective way to pick stocks in exposed industries. As a result, it has managed to avoid the ongoing drawdown suffered by traditional value.
The next table recasts these results, while also splitting the sample period into early and late halves. Traditional value has been inconsistent, struggling both in technologically exposed sectors and in the latter half of the sample. Intangible value, by comparison, has enjoyed consistent outperformance across both sectors and time periods.
Exhibit 18
Annual Returns: Traditional vs. Intangible Value
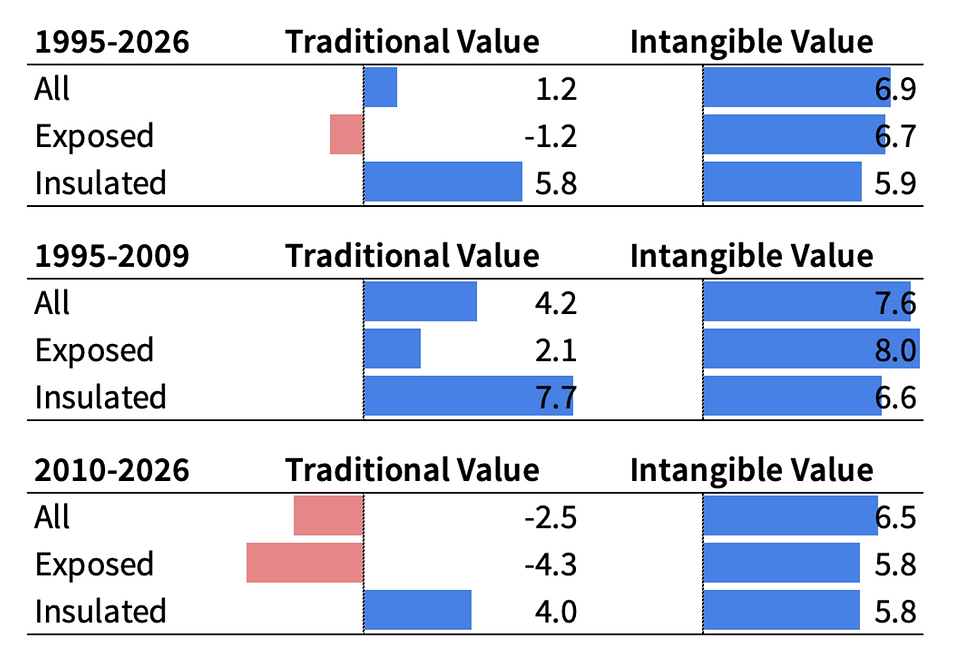
Source: S&P, Sparkline. Relative annual return of top vs. bottom tercile stocks based on intangible value or traditional value, defined as a blend of price/earnings, price/sales, price/book, and price/free cash flow (both trailing and forward). Rebalanced monthly. Universe consists of top U.S. stocks summing to 97% of total market cap. Exposed (insulated) consists of universe stocks with disruption scores greater (less) than 1. No transaction or financing costs. From 12/31/1994 to 4/30/2026. See important backtest disclosure below.
Traditional vs. Intangible Value ⚖️
In order to further explore the difference between traditional and intangible value, the next exhibit shows how the 100 largest U.S. stocks in exposed sectors scored on these two dimensions in 2007, in the midst of the e-commerce and digital media disruptions.
Exhibit 19
Traditional vs. Intangible Value (2007)

Source: S&P, Sparkline. Scores normalized to +/-1. Color coding indicates tercile ranking by subsequent 10-year return. Top 100 U.S. stocks by market cap in the “exposed” universe. Not a recommendation to buy or sell securities. As of 12/31/2006.
We divide these stocks into four quadrants. The upper right contains stocks that both metrics agreed were cheap, such as Accenture and Kroger. The lower left contains those that both metrics agreed were expensive, such as GameStop and Las Vegas Sands. Meanwhile, the lower right contains “value traps,” firms that seemed cheap on traditional value but were expensive on intangible value, such as Wells Fargo and Macy’s. Finally, the upper left contains “expensive” disruptors, stocks that looked expensive on traditional value but cheap on intangible value, such as Amazon and Apple.
We color code each stock based on its subsequent 10-year return. Intangible value did a good job separating winners and losers – most winners are found in the upper quadrants, while most losers sit in the lower quadrants. Traditional value was less effective. In the off-diagonals where it disagreed with intangible value, it generally got it backward, buying losers like Wells Fargo and selling winners like Apple.
As the next exhibit shows, these results generalize for the full period. The best-performing stocks are those that both value metrics agree are cheap, while the worst are those that both agree are expensive. However, in cases where they disagree, intangible value provides the better signal, correctly buying “expensive” disruptors and selling value traps.
Exhibit 20
Annualized Return by Quadrant (1995-2026)

Source: S&P, Sparkline. Annualized returns are percentages. Scores normalized to +/-1. Rebalanced monthly. Universe consists of top U.S. stocks summing to 97% of total market cap in “exposed” industries. No transaction or financing costs. From 12/31/1994 to 4/30/2026. See important backtest disclosure below.
The fact that intangible value is better equipped to evaluate technologically exposed firms is intuitive. Unlike traditional value, intangible value explicitly credits firms for innovation and the associated intangible moats that have become increasingly important in the modern information economy.
Software Selloff
Intangible Value and Software 🧑💻
Over the past year, many software stocks have suffered huge drawdowns due to perceived AI disruption risk. As we just saw, intangible value has had a strong historical track record of finding undervalued stocks in disruptions. What does this framework say about beaten-down software names today?
The next exhibit shows the distribution of intangible value scores for software stocks that have fallen 30% or more over the past year.
Exhibit 21
Intangible Value in the Software Apocalypse

Source: S&P, Sparkline. Universe consists of software stocks with TTM returns less than -30%. Not a recommendation to buy or sell securities. As of 4/30/2026.
The average stock has a positive score, suggesting that the selloff has created real opportunities. However, we find an abnormally long left tail of “value traps” – stocks, such as Duolingo, which appear unattractive even after huge drawdowns. Many of these stocks look cheap on traditional multiples but are screened out on intangible value.
While the sector is not a blanket bargain, we do uncover a handful of software stocks, such as Salesforce, that appear attractive on intangible value. Let’s now explore the two primary drivers of these high scores: complementary moats and AI adoption.
Complementary Moats 🏰
First, even putting aside their AI investments, these high-scoring firms possess robust complementary intangible assets. For many of them, the code was never the moat. Rather, their strengths lie in trusted brands, customer relationships, and regulatory credibility; product and domain expertise; network effects and high switching costs; and accumulated business logic and complementary IP.
Exhibit 22
Software’s Intangible Moats
Pillar | Software Moat |
Intellectual Property | Platform architecture; accumulated business logic; proprietary datasets, algorithms, and AI models; complementary products and adjacent innovations. |
Brand Equity | Vendor trust and category reputation; de facto standard status; perceived reliability, security, and compliance; regulatory credibility; long-standing customer relationships. |
Human Capital | Product and engineering judgment; domain expertise in customer workflows; sales, implementation, and customer-success know-how; adaptive organizational culture. |
Network Effects | Ecosystems of trained professionals, developers, and third-party applications; data feedback loops; switching costs from systems of record, embedded workflows, integrations, standards, customizations, and retraining. |
Source: Sparkline.
These moats are widest in enterprise software, where products often serve as mission-critical systems of record, integrate deeply into customer workflows, and face onerous security and compliance requirements. Even before AI coding, customers had the option to build software in-house or switch to cheaper startups with more modern infrastructure – yet most did not. Rather than reinvent the wheel, they chose to outsource to trusted partners.
The next exhibit decomposes the intangible value scores for these high-scoring software stocks into the four sub-pillars. While each firm has a unique profile, on average we find that all four pillars contribute to the basket’s overall high score, with brand equity and human capital especially important.
Exhibit 23
Software Selloff: Intangible Value Sub-Pillars
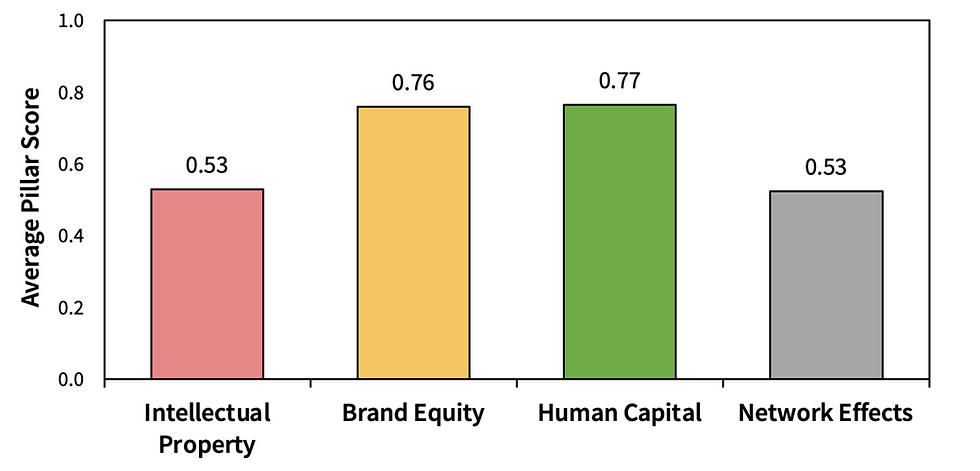
Source: S&P, Sparkline. High-scoring software stocks. As of 4/30/2026.
Incumbent AI Adoption 🤖
Second, these firms recognize AI as the disruptive force it is and are not sitting idly by. The next exhibit from AI Adopters: Beneficiaries of the Boom (Jan 2026) shows the distribution of firm-level AI adoption scores by industry. The scores are created by parsing millions of corporate communications, patents, trademarks, employee LinkedIn profiles, and other documents using LLMs and other tools.
Exhibit 24
AI Adoption by Sector

Source: S&P, Sparkline. As of 12/31/2025. Reproduced from AI Adopters: Beneficiaries of the Boom (Jan 2026).
According to our data, software is the sector most rapidly adopting AI. Software firms know that they are exposed to AI disruption and are taking the threat seriously. For example, job posting data reveal that software firms are pursuing AI talent much more aggressively than those in other sectors.
Exhibit 25
AI Job Postings

Source: S&P, LinkUp, UMD-LinkUp, Sparkline. AI jobs per UMD-LinkUp, augmented by Sparkline. Universe consists of top U.S. stocks summing to 97% of total market cap. From 1/31/2018 to 4/30/2026.
The next exhibit compares AI exposure (Exhibit 11) and AI adoption (Exhibit 24) by sector. We add a regression line to identify the sectors over- or underperforming relative to their AI exposure. On this basis, the software industry stands out as the furthest ahead of the curve on AI adoption.
Exhibit 26
AI Exposure vs. AI Adoption by Sector

Source: S&P, O*NET, LinkUp, OpenAI, Eloundou et al (2023), Sparkline. Exposure data as of 6/30/2023. Adoption data as of 12/31/2025.
While software as a group is leaning into AI, Exhibit 24 also reveals huge dispersion in AI adoption across individual firms. Of course, software firms doing nothing about AI are candidates for disruption. In contrast, those that are actively integrating AI and repositioning their business models for a world of AI agents are more likely to survive and perhaps even capture market share from their laggard peers.
For these early adopters, AI coding tools may actually improve long-term margins by reducing the labor intensity of software development, historically one of the sector’s largest cost centers. With software firms’ liberal use of stock-based compensation (SBC) increasingly under scrutiny, this would be a welcome development for shareholders.
As discussed in AI Adopters: Beneficiaries of the Boom (Jan 2026), intangible value has increasingly rotated into “AI early adopters” – not only in software but also industrials, health care, consumer, and other sectors. We believe that early adopters offer an underrated way to invest in AI beneficiaries without the capital-expenditure and valuation risks.
Software Sweet Spot 🎯
Finally, let’s put these metrics together. The next exhibit scores beaten-down software stocks on two dimensions: AI adoption and intangible value (ex-AI adoption). Since AI adoption is itself one of the inputs into intangible value, removing it allows us to more cleanly identify firms relying on complementary intangible moats outside of AI.
Exhibit 27
Software Selloff: AI Adoption vs. Complementary Moats
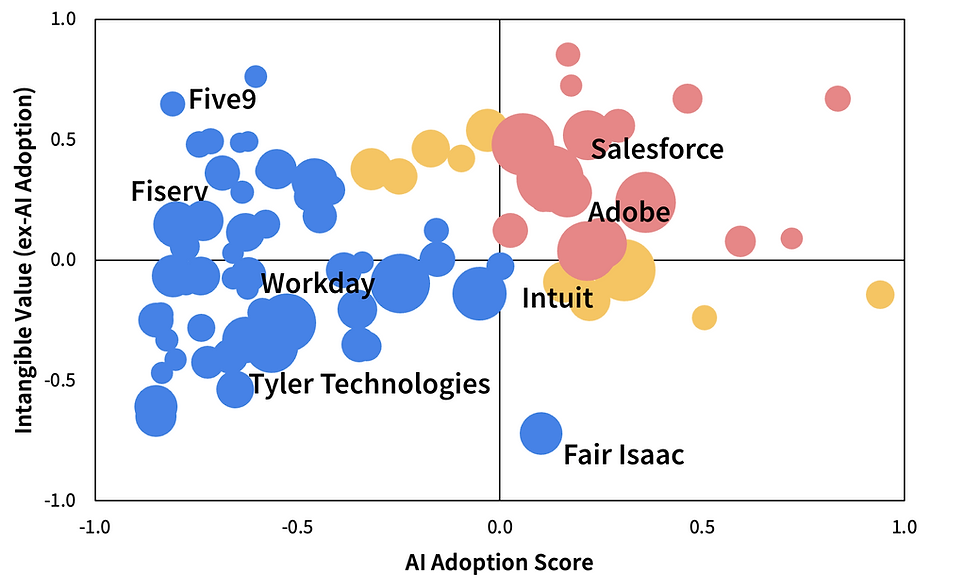
Source: S&P, Sparkline. Universe consists of software stocks with TTM returns less than -30%. Bubbles proportional to market cap. Scores normalized to +/-1. Not a recommendation to buy or sell securities. As of 4/30/2026.
For investors, the sweet spot consists of software companies in the upper right quadrant: AI early adopters with strong complementary moats. These firms not only enjoy naturally defensible businesses but are also actively positioning for the age of AI.
Unfortunately, most beaten-down software firms fall outside this strike zone. At first glance, the selloff may seem like a blanket bargain. However, our intangible value framework points to a more selective conclusion: the software sector exhibits wide dispersion, with some firms positioned to survive and thrive and others at risk of becoming value traps.
Opportunity in Dispersion 🚀
Many software stocks have crashed on AI disruption fears. However, history suggests that this initial market reaction is noisy: some early losers become value traps, but others recover as survivors.
To demonstrate, we generalize from the current crop of software stocks to a broader category we call “Disruption Scare Stocks”: technologically exposed stocks that have fallen 30% or more over the past year. While software dominates this basket today, historically it has included newspapers, retailers, and other disrupted incumbents.
The next exhibit shows the distribution of Disruption Scare Stocks’ subsequent 12-month returns. For comparison, we also show the distribution for the broader stock universe.
Exhibit 28
High Dispersion for Disruption Scare Stocks

Source: S&P, Sparkline. Gaussian KDE of forward 12-month returns. Universe consists of top U.S. stocks summing to 97% of total market cap. From 12/31/1994 to 4/30/2026.
Rather than being doomed, Disruption Scare Stocks actually produced similar median returns to the broader market. As it turns out, the stocks first hit by disruption fears are no more likely to continue to fall than to bounce back. In other words, this basket contains not only Blockbuster-style value traps but also New York Times-style survivors.
Past price action is a poor guide to the eventual winners and losers of disruption. We show this formally in the appendix, finding that a simple momentum strategy that buys winners and sells losers is ineffective in disruptions. This is consistent with Teece’s argument that the early innovators are often not the long-term winners.
However, beneath a similar median lies significantly greater dispersion. For Disruption Scare Stocks, the distribution of future returns has much fatter tails – a staggering 10% of these stocks end up doubling, while 16% are cut in half over the next year. Their interquartile range, another measure of dispersion, is 1.8 times that of the broader market.
Disruption reshuffles the competitive landscape, producing a wider spread between winners and losers. Higher dispersion can be a boon for investors, as it enhances opportunities for stockpicking alpha. If an investor has even a modest ability to distinguish winners from losers, a wider spread of outcomes can translate into greater excess returns.
One advantage of a systematic factor like intangible value is that it can be used to demonstrate this concept empirically. Earlier, we showed that intangible value has outperformed in both the full universe and a subset consisting of exposed stocks. In the next exhibit, we narrow our universe further to Disruption Scare Stocks, a subset of exposed stocks.
Exhibit 29
Intangible Value: Dispersion Drives Higher Returns

Source: S&P, Sparkline. Relative return of top vs. bottom tercile stocks based on intangible value. Rebalanced monthly. Universe consists of top U.S. stocks summing to 97% of total market cap. Exposed consists of universe stocks with disruption scores greater than 1. Disruption Scare Stocks are exposed stocks that also have trailing 12-month returns of -30% or worse. No transaction or financing costs. From 12/31/1994 to 4/30/2026. See important backtest disclosure below.
Indeed, the intangible value factor produced significantly higher returns in Disruption Scare Stocks, due to their much greater dispersion. Consistent with theory, the Sharpe ratio was broadly similar, but the magnitude of returns was much higher. Dispersion amplifies the payoff to a given investment edge.
Today’s software selloff offers a live example of a dispersion-rich opportunity set. For investors able to separate AI survivors from value traps, whether using intangible value or another framework, we believe software stocks represent an unusually attractive stockpicking opportunity today.
Conclusion
Software stocks have taken a beating as investors grapple with the threat of AI disruption. With relative valuations near the lowest levels in recent memory, many value investors’ instinct is to buy the dip.
However, history suggests caution. Across past waves of disruption, traditional value metrics have struggled when applied to stocks facing technological change. Naive measures of cheapness have had an unfortunate tendency to buy value traps and sell innovative winners.
Investors need a broader definition of value for the age of AI. The winners of disruption often possess crucial intangible assets missed by traditional metrics – not only innovative intellectual property but also the complementary intangible moats needed to profit from it. We find that an expanded value metric incorporating these intangibles can help separate disruption’s winners from its losers.
Applied to the software selloff, this framework points to a selective opportunity. While the sector is not uniformly cheap, several software stocks with credible AI investments and complementary intangible moats look attractive. By widening the gap between winners and losers, disruption creates fertile ground for applying this framework today.
Appendix: The Myths of Disruption 🧚
The next exhibit shows the Sharpe ratios of several factors applied in technologically exposed industries.
Exhibit A1
Factor Performance in Technologically Exposed Sectors

Source: S&P, Sparkline. Relative return of top vs. bottom tercile. Rebalanced monthly. Universe consists of U.S. stocks summing to 97% of market cap with disruption scores over 1. Factors, not defined elsewhere, sort on the following: Small-Cap: market cap, Young: months since founding, Quality: return on equity. No transaction or financing costs. From 12/31/1994 to 4/30/2026. See important backtest disclosure below.
First, we show the performance of the intangible value and traditional value factors. As demonstrated in the main body of the paper, intangible value has been effective in exposed sectors while traditional value actually operated in reverse.
Second, we define the momentum factor as a long-short strategy that buys stocks with high trailing 1-year returns and sells those with low trailing 1-year returns. It has produced positive but insignificant excess returns, suggesting that past price performance is a poor guide to the eventual winners and losers of disruption.
Third, we include the performance of small-cap and age factors. This addresses another popular narrative: that young, lean startups inevitably disrupt lazy incumbents. While this storyline is compelling, systematically buying small-cap or young firms in periods of disruption has not produced significant outperformance.
Exciting new technologies like AI often get wrapped up in the mythology of disruption. Investors are tempted to project these narratives onto the market, rushing toward hot, fast-growing startups like OpenAI and Anthropic, while dumping struggling legacy incumbents. Empirical evidence, however, suggests that these narratives are often more myth than reality.
Finally, for completeness we test the quality factor. While quality does produce positive excess returns, these returns do not quite meet the requirements for statistical significance. Ultimately, intangible value remains the only systematic factor that we find reliably works in periods of disruption.
Disclaimer
This paper is solely for informational purposes and is not an offer or solicitation for the purchase or sale of any security, nor is it to be construed as legal or tax advice. References to securities and strategies are for illustrative purposes only and do not constitute buy or sell recommendations. The information in this report should not be used as the basis for any investment decisions.
We make no representation or warranty as to the accuracy or completeness of the information contained in this report, including third-party data sources. This paper may contain forward-looking statements or projections based on our current beliefs and information believed to be reasonable at the time. However, such statements necessarily involve risk and uncertainty and should not be used as the basis for investment decisions. The views expressed are as of the publication date and subject to change at any time.
Backtest Disclosure
The performance shown reflects the simulated model performance an investor may have obtained had it invested in the manner shown but does not represent performance that any investor actually attained. This performance is not representative of any actual investment strategy or product and is provided solely for informational purposes.
Hypothetical performance has many significant limitations and may not reflect the impact of material economic and market factors if funds were actually managed in the manner shown. Actual performance may differ substantially from simulated model performance. Simulated performance may be prepared with the benefit of hindsight and changes in methodology may have a material impact on the simulated returns presented.
The simulated model performance is adjusted to reflect the reinvestment of dividends and other income. Simulations that include estimated transaction costs assume the payment of the historical bid-ask spread and $0.01 in commissions. Simulated fees, expenses, and transaction costs do not represent actual costs paid.
Index returns are shown for informational purposes only and/or as a basis of comparison. Indexes are unmanaged and do not reflect management or trading fees. One cannot invest directly in an index.
No representation or warranty is made as to the reasonableness of the methodology used or that all methodologies used in achieving the returns have been stated or fully considered. There can be no assurance that such hypothetical performance is achievable in the future. Past performance is no guarantee of future results.